
Page 58 - scheppingen
P. 58
three
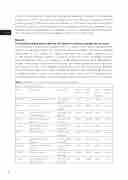
Top 10 over-expressed genes
Gene Description Chr. Location FPKM FPKM Log2 BH adj. Control TSC (Fold- p-value
change)
PLA2G2A phospholipase A2 group IIA chr1:19975430- 0.2128 10.6491 5.6454 0.0044 19980416
PRPH peripherin chr12:49287568- 0.8807 35.6832 5.3404 0.0044 49331731
C21orf62 chromosome 21 open chr21:32772099- 0.3509 13.9016 5.3081 0.0044 reading frame 62 32893735
CCL4 C-C motif chemokine chr17:36103589- 1.6944 58.3646 5.1063 0.0044 ligand 4 36105621
CCL4L1 C-C Motif Chemokine chr17:36116176- 2.7548 69.1906 4.6505 0.0044 Ligand 4 like 1 36439566
LTF Lactotransferrin chr3:46416525- 2.0545 50.5365 4.6204 0.0044 46485234
CCL3 C-C Motif Chemokine chr17:36072865- 2.5844 58.6895 4.5052 0.0110 Ligand 3 36090169
SLC47A2 Solute Carrier Family 47 chr17:19678276- 0.1928 4.2615 4.4660 0.0044 Member 2 19718979
CHI3L2 Chitinase 3 Like 2 chr1:111187058- 7.0674 152.6110 4.4325 0.0044 111243446
CCL3L3 C-C Motif Chemokine chr17:36116176- 1.9783 39.4745 4.3186 0.0044 Ligand 3 Like 3 36439566
56
in PBS and incubated with AlexaFluor-conjugated secondary antibodies in the blocking buffer for 2 hr at RT. They were then washed 2 times with PBS and incubated with DAPI (nuclear) staining. After final washes with PBS for 20 min, the neurons were mounted on slides with Fluorsave (Merck Millipore) mounting medium. Images were obtained at 20x magnification with epifluoroscent Axioscope A1 (Zeiss) microscope. Neurite outgrowth was analyzed using NeuroMath developed at Weizmann Institute, Israel.
Results
The protein coding transcriptome of tuberous sclerosis complex brain tissue To characterize the brain transcriptome of TSC subjects, RNA-Seq was performed on mRNA extracted from tubers and normal control brain samples. The analysis included tubers from 12 TSC subjects (10 surgical specimens and 2 autopsy specimens) and 10 age-matched controls without a history of seizures or other neurological disease (See methods and Table 1). On average 23 million paired-end reads were produced per sample. After quality assessment and filtering ~20 million paired-end reads remained per sample, of which ~77% mapped concordantly to the GRCh38 reference genome. Differential gene expression analysis revealed 438 differentially expressed genes (abso- lute fold-change of > 1.5 or <-1.5 and adjusted p-value < 0.05) in the TSC cortical tubers compared to control cortex, 269 of these genes were over-expressed and 169 under-ex-
Table 2 Top 10 up- and under-expressed protein-coding genes.
