
Page 59 - scheppingen
P. 59
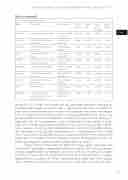
Table 2 (continued)
CODING AND SMALL NON-CODING TRANSCRIPTIONAL LANDSCAPE OF TSC
 Top 10 under-expressed genes
    Gene Description Chr. Location FPKM FPKM Log2 BH adj. Control TSC (Fold- p-value
change)
 HEATR6 Heat Repeat Containing 6 chr17:60040882- 892.769 5.4155 -7.3650 0.0044 60079182
 SLC30A2 Solute Carrier Family 30 chr1:26037251- 2.8143 0.0575 -5.6137 0.0159 Member 2 26046160
    SLC22A8 Solute Carrier Family 22 chr11:62934677- 2.8123 0.0609 -5.5293 0.0044 Member 8 63412981
 IL1RL1 Interleukin 1 Receptor chr2:102311501- 19.0343 0.7561 -4.6539 0.0044 Like 1 102398775
    HSPA6 Heat Shock Protein Family chr1:161505429- 68.4820 2.9318 -4.5459 0.0324 A (Hsp70) Member 161678654
 SERPIND1 Serpin Family D Member chr22:20707686- 2.6156 0.1329 -4.2992 0.0159 20891218
 SLC13A4 Solute Carrier Family 13 chr7:135662487- 9.6643 0.6905 -3.8069 0.0044 Member 4 135748846
    SLC5A5 Solute Carrier Family 5 chr19:17871961- 1.0909 0.0895 -3.6078 0.0044 Member 5 17895174
 DCX Doublecortin chrX:111293779- 10.8126 1.1125 -3.2808 0.0044 111412375
    ST8SIA2 ST8 alpha-N-acetyl- chr15:92393827- 3.7169 0.5488 -2.7598 0.0044 neuraminide alpha-2,8- 92468728
sialyltransferase 2
  pressed (Fig. 1a). The top 10 over-expressed and under-expressed protein-coding genes (ranked by fold-change) are listed in Table 2. Ingenuity pathway analysis revealed that genes with enhanced expression in tubers were associated with innate and adaptive immune response canonical signaling pathways, including the complement system, trig- gering receptor expressed on myeloid cells 1 (TREM1) signaling, and CD28 signaling in T helper cells (Fig. 1b). The complement system represented the most significant associ- ation, with increased expression of complement C1q A chain (C1QA) (3.5-fold), comple- ment C1q B chain (C1QB) (3.9-fold), complement C1q C chain (C1QC) (3.5-fold), comple- ment component 3 (C3) (9.2-fold) and complement C1r subcomponent (C1R) (2.2-fold) (Fig. 1c). No canonical signaling pathways were associated with genes that had decreased expression in TSC patients. RT-qPCR targeting a selection of complement system and TREM1 signaling genes validated the RNA-Seq data (data not shown).
To gain a better understanding of potential cell-type specific gene expression related to TSC pathology an independent dataset of single-cell RNA-Seq from neurons, microglia, oligodendrocytes or astrocytes taken from healthy human cortex was analyzed (GSE67835)45. Genes from the single-cell RNA-Seq analysis were classified as microglia, oligodendrocyte, astrocyte and neuron specific based on expression values (greater than 10 read-counts in cell type of interest, less than 1 read count in all other cell-types).
57
three
