
Page 76 - Imaging of Osteoarthritis and Rheumatoid Arthritis in Hand Joints
P. 76
Chapter 4
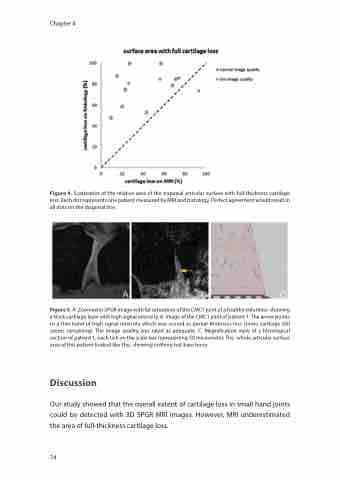
Figure 4. Scatterplot of the relative area of the trapezial articular surface with full-thickness cartilage loss. Each dot represents one patient measured by MRI and histology. Perfect agreement would result in all dots on the diagonal line.
Figure 5. A: Zoomed in SPGR image with fat saturation of the CMC1 joint of a healthy volunteer, showing a thick cartilage layer with high signal intensity. B: Image of the CMC1 joint of patient 1. The arrow points to a thin band of high signal intensity which was scored as partial thickness loss (some cartilage still seems remaining). The image quality was rated as adequate. C: Magnification view of a histological section of patient 1, each tick on the scale bar representing 50 micrometer. The whole articular surface area of this patient looked like this, showing nothing but bare bone.
Discussion
Our study showed that the overall extent of cartilage loss in small hand joints could be detected with 3D SPGR MRI images. However, MRI underestimated the area of full-thickness cartilage loss.
74
