
Page 74 - Imaging of Osteoarthritis and Rheumatoid Arthritis in Hand Joints
P. 74
Chapter 4
between the original articular surface and osteophytes was the main cause of variations in scoring, as it was inconsistently scored where the articular surface stopped and the osteophyte began.
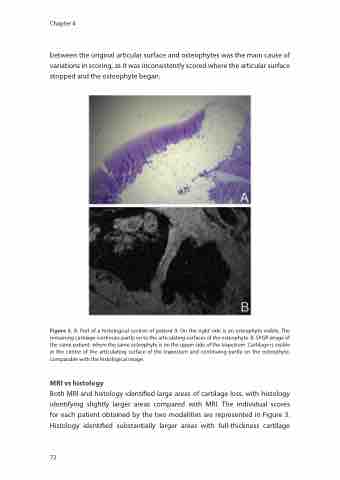
Figure 2. A: Part of a histological section of patient 9. On the right side is an osteophyte visible. The remaining cartilage continues partly on to the articulating surfaces of the osteophyte. B: SPGR image of the same patient, where the same osteophyte is on the upper side of the trapezium. Cartilage is visible in the centre of the articulating surface of the trapezium and continuing partly on the osteophyte, comparable with the histological image.
MRI vs histology
Both MRI and histology identified large areas of cartilage loss, with histology identifying slightly larger areas compared with MRI. The individual scores for each patient obtained by the two modalities are represented in Figure 3. Histology identified substantially larger areas with full-thickness cartilage
72
