
Page 140 - Secondary school students’ university readiness and their transition to university Els van Rooij
P. 140
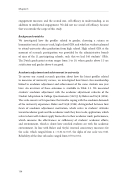
                                Table 5.2 Outcome measures
Factor Measurement information or sample item
Achievement
GPA Average self-reported grade attained at courses in the  rst semester of university.
EC Self-reported number of credits attained in the  rst semester of university. Since not all degrees
had the same number of credits that could be earned, this measure had a scale from 1 (none of the credits that could be attained) to 5 (all of the credits that could be attained so far).
Academic adjustment
Number of items
NA NA
24
6 4 9 5
Scale Cronbach’s range alpha
1-10 NA 1-5 NA
1-5 .86
1-5 .71 1-5 .70 1-5 .73 1-5 .81
Overall academic adjustment
Motivation Application Performance Environment
I enjoy academic work.
I keep up-to-date with academic work.
I  nd academic work di cult. (reverse coded) I am satis ed with the programme of courses.
Pro les of student engagement
     5.5.3 Procedure 5 Secondary school data was gathered in 2014. A er obtaining informed consent
from the students’ parents, the participating students were asked by the researcher
or a teacher instructed by the researcher to  ll out three questionnaires (need for
cognition, engagement, and learning strategies; college self-e cacy and academic interest; and study choice process (not used in this study)).  e questionnaires were all paper-and-pencil tests, and students completed them at the beginning of two separate classes, in order to prevent fatigue. Overall, it took the students about an hour to complete all questionnaires. University data was gathered in 2015 through an online questionnaire. Participants gave consent to use their data and to merge their results with the data gathered in high school one year earlier.
5.5.4 Statistical analyses
To identify the optimal number of latent groups that could be identi ed in the data from the continuous indicator variables, we conducted a latent pro le analysis (LPA) using Mplus 7. Because the scales of the indicator variables had di erent ranges, we standardised the scores. We  tted models varying from a two- to six- class solution. We used several  t statistics to determine which model  t the data best: Akaike’s information criterion (AIC; Akaike, 1987), Bayesian information criterion (BIC; Schwartz, 1978), adjusted BIC (ABIC), Vuong-Lo-Mendell-Rubin likelihood ratio test (VLMRT; Vuong, 1989), and the entropy statistic. For the
139
