
Page 141 - Secondary school students’ university readiness and their transition to university Els van Rooij
P. 141
Chapter 5
AIC, BIC, and ABIC, lower values are proof of a better tting model (Flaherty & Ki , 2012). e VLMRT compares models for k and k – 1 classes. If the ratio test results in a signi cant p-value, the k class model is a better t than the k – 1 class model (To ghi & Enders, 2008). Higher entropy indicates less classi cation error (Collins & Lanza, 2010). As has been discussed widely though (e.g., Marsh, Lüdtke, Trautwein, & Morin, 2009; Pastor, Barron, Miller, & Davis, 2007), t statistics do not tell the whole story and should not be followed blindly. erefore, we also determined whether the classes in a k class solution were interpretable and meaningful, by checking their face validity and determining the percentage of students in the smallest class. We thus could con rm that the classes were large enough to be meaningful and of practical value.
A er determining which number of classes t the data best, we assigned students to the class for which their probability of membership was highest. With analyses of variance (ANOVAs) and post hoc comparisons (Bonferroni), we investigated di erences between the latent classes on the indicator variables. To investigate whether the latent classes di ered regarding achievement and adjustment in university we performed ANCOVAs, so that we could control for di erences due to age, gender, and coursework in secondary school (science vs. humanities/social sciences).
5.6 Results
5.6.1 Fit statistics
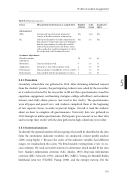
Table 5.3 shows the goodness-of- t measures that we used to determine the number of classes that provided the best t for our data. Considering the signi cant p-value of the VLMRT, the entropy value, and the substantial drop in the ABIC from the four- to the ve-class solution, we determined that the ve- class solution o ered the best t. Across the ve groups identi ed by the LPA, we found that they di ered in meaningful ways and were su ciently large to have practical value (>5%). On the basis of both the interpretability of the classes and the model t indices, we thus chose a ve-class solution.
140
