
Page 138 - Secondary school students’ university readiness and their transition to university Els van Rooij
P. 138
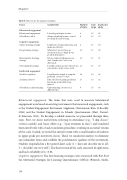
                                Garcia, & McKeachie, 1991). We made some slight adaptations to the MSLQ: Instead of referring to a speci c subject, we rephrased the statements to refer to students’ general habits of studying, regardless of the subject.  e reasoning behind this was that we were interested in students’ general strategy use, regardless of how interested they were in a subject, as in university studies they would also encounter classes that may and may not interest them. Following Vrugt and Oort (2008), we used the MSLQ rehearsal subscale to form the surface learning strategy and the elaboration, organization, and critical thinking subscales to form the deep learning strategy.  e metacognitive learning strategy consisted of the metacognitive self-regulation subscale from the MSLQ. Self-regulated learning consisted of the time/study environmental management and e ort regulation subscales.  e internal consistency scores ranged from 0.60 to 0.80.
Intellectual engagement. Need for cognition was measured with 18 items from
the e cient version of the Need for Cognition scale by Cacioppo et al. (1984).
It consists of one factor and has good internal consistency (Sadowski, 1993); we
found α = 0.86.  e extent to which a student has academic interest (regardless of 5 the domain, so not only natural sciences but also humanities and social sciences)
was measured by 17 items, based on the Scienti c Attitude Inventory II (SAI II; Moore & Foy, 1997).  e same three development stages were followed as for the behavioural engagement measure. Students responded on a  ve-point Likert-scale (1 = ‘completely disagree’; 5 = ‘completely agree’). Academic interest was internally consistent (α = 0.92).
Self-e cacy. To measure self-e cacy, we used items from the College Academic Self-E cacy Scale (CASES; Owen & Froman, 1988).  is questionnaire contains typical behaviours that students need to demonstrate at university.  e respondents rated, on a  ve-point Likert scale, how con dent they were that they could perform these behaviours.  ree items from the original questionnaire were dropped because they were not appropriate for the current situation at Dutch universities. Previous research has reported good internal consistency (Olani, 2009; Owen & Froman, 1988), and we found α = 0.88. In addition to the overall factor, the factor analysis in SPSS distinguished three separate factors of college self-e cacy: con dence in putting in the necessary e ort (e.g., attending class even when you  nd the topic boring, α = 0.73), con dence in behaviours associated with understanding di cult content (α = 0.85), and con dence in social skills typical of university life (e.g., making new friends, attending social activities, α = 0.66). We used the  rst measure, self-e cacy in e ort, as an addition to the behavioural
Pro les of student engagement
  137
