
Page 50 - Magnesium-based supports for stem cell therapy of vascular disease - Mónica Echeverry Rendón
P. 50
CHAPTER 3
layer, it is expected that the NAF-G1 coating is more compact than NAF G2 and NAF G3.
Those curves showed extensive voltage oscillations (pronounced picks) which are associated with the sparking oc- curred when the potential reached the breakdown point. This behavior have a direct effect on the morphology of the coatings affecting the porosity and uniformity of the film.
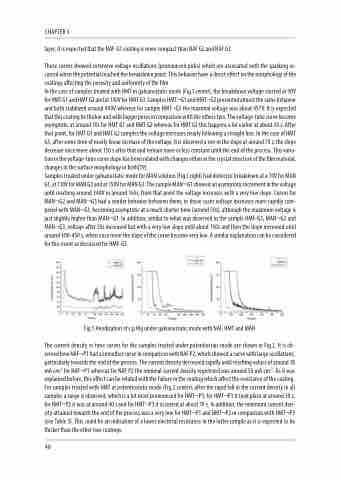
In the case of samples treated with HMT in galvanostatic mode (Fig.1.center), the breakdown voltage started at 90V for HMT G1 and HMT G2 and at 130V for HMT G3. Samples HMT¬G1 and HMT¬G2 presented almost the same behavior and both stabilized around 400V whereas for sample HMT¬G3 the maximal voltage was about 457V. It is expected that this coating be thicker and with bigger pores in comparison with the others two. The voltage-time curve become asymptotic at around 70s for HMT G1 and HMT G2 whereas for HMT G3 this happens a lot earlier at about 30 s. After that point, for HMT G1 and HMT G2 samples the voltage increases nearly following a straight line. In the case of HMT G3, after some time of nearly linear increase of the voltage, it is observed a rise in the slope at around 70 s; the slope decrease once more about 150 s after that and remain more or less constant until the end of the process. This varia- tion in the voltage-time curve slope has been related with changes either in the crystal structure of the film material, changes in the surface morphology or both[19].
Samples treated under galvanostatic mode for MAN solution (Fig.1.right) had dielectric breakdown at a 70V for MAN G1, at 110V for MAN G2 and at 150V for MAN G3. The sample MAN¬G1 showed an asymptotic increment in the voltage until reaching around 340V in around 165s; from that point the voltage increases with a very low slope. Curves for MAN¬G2 and MAN¬G3 had a similar behavior between them, in those cases voltage increases more rapidly com- pared with MAN¬G1, becoming asymptotic at a much shorter time (around 50s), although the maximum voltage is just slightly higher than MAN¬G1. In addition, similar to what was observed in the sample HMF-G3, MAN¬G2 and MAN¬G3, voltage after 50s increased but with a very low slope until about 150s and then the slope increased until around 400-450 s, when once more the slope of the curve become very low. A similar explanation can be considered for this event as discussed for HMF-G3.
Fig.1 Anodization of c.p Mg under galvanostatic mode with NAF, HMT and MAN
The current density vs time curves for the samples treated under potentiostaic mode are shown in Fig.2. It is ob- served how NAF¬P1 had a smoother curve in comparison with NAF P2, which showed a curve with large oscillations, particularly towards the end of the process. The current density decreased rapidly until reaching values of around 18 mA.cm-2 for NAF¬P1 whereas for NAF P2 the minimal current density registered was around 50 mA.cm-2. As it was explained before, this effect can be related with the failure in the coating which affect the resistance of the coating. For samples treated with HMT at potentiostatic mode (Fig.2.center), after the rapid fall in the current density in all samples a surge is observed, which is a lot most pronounced for HMT¬P3; for HMT¬P1 it took place at around 30 s, for HMT¬P2 it was at around 40 s and for HMT¬P3 it occurred at about 70 s. In addition, the minimum current den- sity attained towards the end of the process was a very low for HMT¬P1 and HMT¬P2 in comparison with HMT¬P3 (see Table 3). This could be an indication of a lower electrical resistance in the latter sample as it is expected to be thicker than the other two coatings.
48
