
Page 95 - Human Bile Acid Metabolism: a Postprandial Perspective
P. 95
Short term starvation and bile acid supplementation
Plasma GLP-1 and FGF19 concentrations after 40 h of fasting. Forty hours of fasting did not change GLP-1 baseline concentrations (baseline 14 h FAST: 4.4 [8.7] pmol/L vs. 40 h FAST: 7.1 [15.0] pmol/L; P > 0.05) but increased postprandial AUC of GLP-1 (AUC0-180 14 h FAST: 1,896.0 [2,463.8] pmol/L × min vs. 40 h FAST: 2,232.0 [2,470.5] pmol/L × min; P < 0.05, 2-way RM-ANOVA P = 0.059) (Fig. 1G). The iAUC analysis for GLP-1 showed no differences (data not shown).
Forty hours of fasting increased FGF19 baseline concentrations (baseline 14 h
FAST: 0.10 [0.07] ng/mL vs. 40 h FAST: 0.22 [0.40] ng/mL; P < 0.05), thereby tremendously increasing postprandial AUC of FGF19 (AUC0-240 14 h FAST: 58.6
[44.3] ng/mL × min vs. 40 h FAST: 123.8 [124.1] ng/mL × min; P < 0.05, 2-way
RM-ANOVA P < 0.01, post hoc analysis T60 and T180 (P < 0.05), T90 and T120
P < 0.001) (Fig. 1E). However, postprandial iAUC of FGF19 was not increased
after 40 h of fasting (AUC0–240 14 h FAST: 33.4 [28.2] ng/mL × min vs. 40 h FAST 5 65.8 [49.8] ng/mL × min; P > 0.05). Additionally, we measured 7α-hydroxy-4- cholesten-3-one (C4) as a marker of bile acid synthesis. In contrast to FGF19, 40
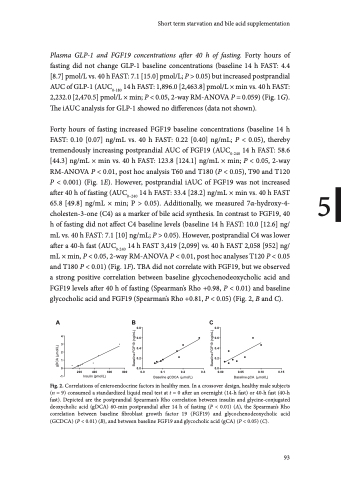
h of fasting did not affect C4 baseline levels (baseline 14 h FAST: 10.0 [12.6] ng/ mL vs. 40 h FAST: 7.1 [10] ng/mL; P > 0.05). However, postprandial C4 was lower after a 40-h fast (AUC0-240 14 h FAST 3,419 [2,099] vs. 40 h FAST 2,058 [952] ng/ mL × min, P < 0.05, 2-way RM-ANOVA P < 0.01, post hoc analyses T120 P < 0.05 and T180 P < 0.01) (Fig. 1F). TBA did not correlate with FGF19, but we observed a strong positive correlation between baseline glycochenodeoxycholic acid and FGF19 levels after 40 h of fasting (Spearman’s Rho +0.98, P < 0.01) and baseline glycocholic acid and FGF19 (Spearman’s Rho +0.81, P < 0.05) (Fig. 2, B and C).
ABC 0.8 0.8
4 3 2 1 0 -1
200 400 600 800
Insulin (pmol/L)
0.6 0.6
0.4 0.4
0.2 0.2
0.0 0.0 0.0 0.1 0.2 0.3 0.00
Baseline gCDCA (Pmol/L)
0.05 0.10 0.15
Baseline gCA (Pmol/L)
Fig. 2. Correlations of enteroendocrine factors in healthy men. In a crossover design, healthy male subjects (n = 9) consumed a standardized liquid meal test at t = 0 after an overnight (14-h fast) or 40-h fast (40-h fast). Depicted are the postprandial Spearman’s Rho correlation between insulin and glycine-conjugated deoxycholic acid (gDCA) 60-min postprandial after 14 h of fasting (P < 0.01) (A), the Spearman’s Rho correlation between baseline fibroblast growth factor 19 (FGF19) and glycochenodeoxycholic acid (GCDCA) (P < 0.01) (B), and between baseline FGF19 and glycocholic acid (gCA) (P < 0.05) (C).
93
gDCA (Pmol/L)
Baseline FGF19 (ng/mL)
Baseline FGF19 (ng/mL)
