
Page 35 - Human Bile Acid Metabolism: a Postprandial Perspective
P. 35
total, unconjugated, and glycine and taurine conjugates of DCA and UDCA were also higher in T2D patients vs NGT subjects (Supplemental Table 1).
2
Postprandial bile acid concentrations
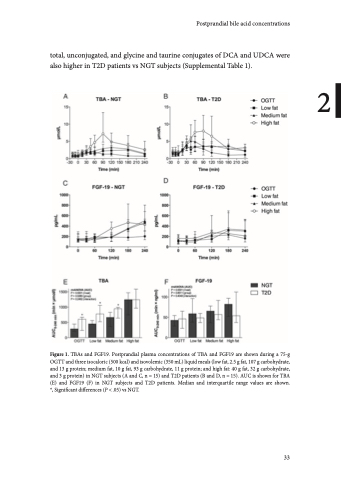
Figure 1. TBAs and FGF19. Postprandial plasma concentrations of TBA and FGF19 are shown during a 75-g OGTT and three isocaloric (500 kcal) and isovolemic (350 mL) liquid meals (low fat, 2.5 g fat, 107 g carbohydrate, and 13 g protein; medium fat, 10 g fat, 93 g carbohydrate, 11 g protein; and high fat: 40 g fat, 32 g carbohydrate, and 3 g protein) in NGT subjects (A and C, n = 15) and T2D patients (B and D, n = 15). AUC is shown for TBA (E) and FGF19 (F) in NGT subjects and T2D patients. Median and interquartile range values are shown. *, Significant differences (P < .05) vs NGT.
33
