
Page 33 - Human Bile Acid Metabolism: a Postprandial Perspective
P. 33
Postprandial bile acid concentrations
2
31
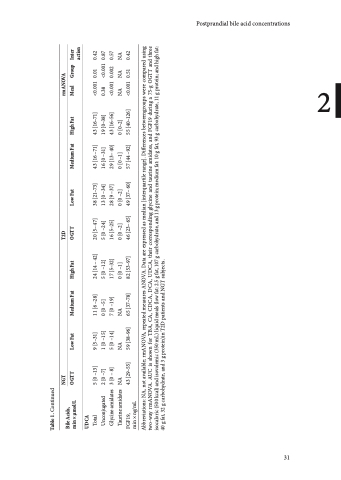
Table 1. Continued Bile Acids,
NGT OGTT
T2D OGTT
rmANOVA
min × μmol/L UDCA
Low Fat
Medium Fat
High Fat
Low Fat
Medium Fat
High Fat
Meal Group Inter action
Total Unconjugated Glycine amidates Taurineamidates
5 [0 –13] 2 [0 –7] 3 [0 – 8] NA
9 [5–31] 1 [0 –15] 5 [0 –14] NA
11 [6 –28] 0 [0 –5]
7 [0 –19] NA
24 [14 – 42] 5 [0 –12] 17 [5–32] 0[0–1]
20 [5– 47] 5 [0 –24] 16 [5–25] 0[0–2]
46 [23– 65]
38 [21–73] 13 [0 –34] 28 [9 –37] 0[0–2]
49 [37– 60]
43 [16 –71] 16 [0 –31] 29 [13– 40] 0[0–1]
43 [16–71] 19 [0–38] 43 [16–56] 0[0–2]
<0.001 0.01 0.42 0.38 <0.001 0.87 <0.001 0.002 0.57 NA NA NA <0.001 0.51 0.42
FGF19,
min × ng/mL
43 [29–55]
59 [38–96]
65 [37–78]
82 [53–97]
57 [44 –92]
55 [40–126]
Abbreviations: NA, not available; rmANOVA, repeated measures ANOVA. Data are expressed as median [interquartile range]. Differences betweengroups were compared using two-way rmANOVA. AUC is shown for TBA, CA, CDCA, DCA, UDCA, their corresponding glycine and taurine amidates, and FGF19 during a 75-g OGTT and three isocaloric (500 kcal) and isovolemic (350 mL) liquid meals (low fat: 2.5 g fat, 107 g carbohydrate, and 13 g protein; medium fat: 10 g fat, 93 g carbohydrate, 11 g protein; and high fat: 40 g fat, 32 g carbohydrate, and 3 g protein)in T2D patients and NGT subjects.
