
Page 36 - Human Bile Acid Metabolism: a Postprandial Perspective
P. 36
Chapter 2
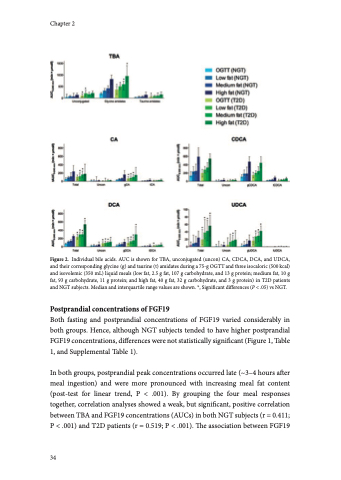
Figure 2. Individual bile acids. AUC is shown for TBA, unconjugated (uncon) CA, CDCA, DCA, and UDCA, and their corresponding glycine (g) and taurine (t) amidates during a 75-g OGTT and three isocaloric (500 kcal) and isovolemic (350 mL) liquid meals (low fat, 2.5 g fat, 107 g carbohydrate, and 13 g protein; medium fat, 10 g fat, 93 g carbohydrate, 11 g protein; and high fat, 40 g fat, 32 g carbohydrate, and 3 g protein) in T2D patients and NGT subjects. Median and interquartile range values are shown. *, Significant differences (P < .05) vs NGT.
Postprandial concentrations of FGF19
Both fasting and postprandial concentrations of FGF19 varied considerably in both groups. Hence, although NGT subjects tended to have higher postprandial FGF19 concentrations, differences were not statistically significant (Figure 1, Table 1, and Supplemental Table 1).
In both groups, postprandial peak concentrations occurred late (~3–4 hours after meal ingestion) and were more pronounced with increasing meal fat content (post-test for linear trend, P < .001). By grouping the four meal responses together, correlation analyses showed a weak, but significant, positive correlation between TBA and FGF19 concentrations (AUCs) in both NGT subjects (r = 0.411; P < .001) and T2D patients (r = 0.519; P < .001). The association between FGF19
34
