
Page 32 - Human Bile Acid Metabolism: a Postprandial Perspective
P. 32
Chapter 2
30
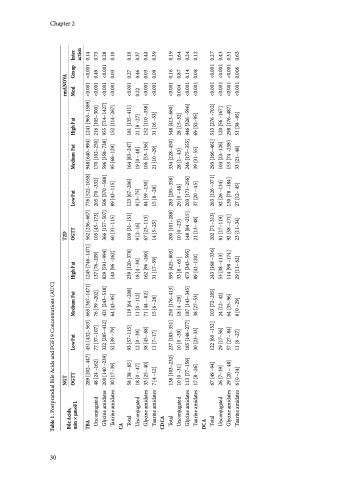
Table 1. Postprandial Bile Acids and FGF19 Concentrations (AUC)
Bile Acids, min × μmol/L
NGT OGTT
T2D OGTT
rmANOVA
TBA
289 [202– 447] 48 [24 –162] 200 [140 –239] 30 [17–39]
451 [432–563] 77 [37–107] 322 [285–412] 52 [39 –79]
665 [367–1471] 76 [39 –202] 421 [243–518] 64 [43–95]
1245 [746–1471] 137 [76–209] 829 [591–994] 140 [96 –262]
562 [236–667] 105 [45–173] 366 [157–507] 60 [31–115]
776 [522–1058] 205 [70 –332] 506 [370 –588] 89 [43–115]
948 [640–994] 170 [102–250] 596 [358–738] 95 [68–129]
1241 [965–1589] 216 [105–300] 955 [714–1427] 152 [114–267]
<0.001 <0.001 0.14 <0.001 0.49 0.73 <0.001 <0.001 0.28 <0.001 0.03 0.10
Unconjugated Glycine amidates Taurine amidates
CA
Total Unconjugated Glycine amidates Taurine amidates
58[38–85] 18[0–47] 33 [25– 40] 7 [4 –12]
93 [57–115] 12 [0 –39] 58 [45– 68] 11 [7–17]
119 [64 –208] 11 [0 –112] 71[44–82] 15 [6 –28]
239 [120–378] 18 [4 –30] 162 [96 –260] 31 [17–59]
109 [31–151] 9 [2–16]
67 [23–113] 14 [5–25]
123 [67–206] 9 [3–75]
84 [59 –130] 15 [8 –28]
164 [83–247] 19[0–48] 106 [53–156] 21 [10 –29]
181 [135–411] 21 [8 –27]
152 [110 –338] 31 [16 –53]
<0.001 0.27 0.19 0.22 0.46 0.37 <0.001 0.03 0.44 <0.001 0.09 0.39
CDCA
Total Unconjugated Glycine amidates Taurine amidates
138 [103–232] 10 [0 –31] 113 [77–159] 17 [8 –26]
237 [183–351] 10 [0 –39]
185 [148–277] 30 [23–33]
250 [176–413] 18 [4 –29]
187 [143–345] 38 [27–53]
595 [425–803] 33[8–65] 473 [343–595] 89 [41–120]
200 [101–288] 10 [0 –23] 148 [84 –215] 21 [13– 48]
283 [205–358] 20[0–48] 203 [171–256] 37[20–45]
334 [228–450] 28 [1– 43]
246 [175–355] 39 [31–55]
548 [413–660] 28 [15–52] 446 [326 –596] 69 [52–95]
<0.001 0.16 0.19 0.004 0.87 0.64 <0.001 0.14 0.24 <0.001 0.08 0.12
DCA
Total Unconjugated Glycine amidates Taurine amidates
67 [49 –94] 26 [7–39] 29[20–48] 6 [0 –14]
122 [60 –152] 29 [17–56] 57 [27– 84] 11 [6 –27]
103 [72–205] 24 [12– 42] 64 [35–96]
8 [0 –29]
243 [168 –336] 53 [38 –113] 114 [98 –174] 29 [11– 62]
202 [71–313] 81 [17–119] 92 [58 –171] 23 [11–34]
263 [126 –371] 92 [26 –134] 130 [78 –184] 27 [12– 45]
293 [166–461] 104 [23–126] 153 [74 –238] 33 [21– 48]
513 [276 –702] 120 [56 –167] 298 [176–487] 51 [38 –95]
<0.001 <0.001 0.27 <0.001 <0.001 0.43 <0.001 <0.001 0.31 <0.001 0.006 0.63
Low Fat
Medium Fat
High Fat
Low Fat
Medium Fat
High Fat
Meal Group Inter action
