
Page 133 - Human Bile Acid Metabolism: a Postprandial Perspective
P. 133
Diurnal rythm of bile acids
7
131
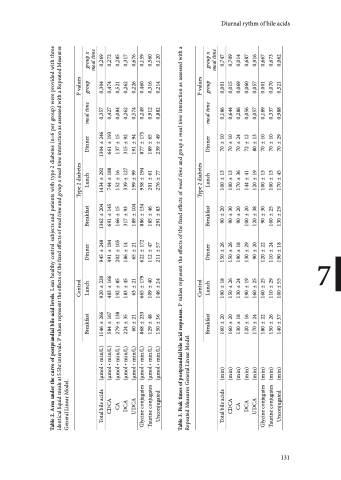
Table 2. Area under the curve of postprandial bile acid levels. Lean healthy control subjects and patients with type 2 diabetes (n=6 per group) were provided with three identical liquid meals at 5.5hr intervals. P values represent the effects of the fixed effects of meal time and group x meal time interaction as assessed with a Repeated Measures General Linear Model.
Total bile acids CDCA
CA
DCA UDCA Glycine conjugates Taurine conjugates Unconjugated
(μmol • min/L) (μmol • min/L) (μmol • min/L) (μmol • min/L) (μmol • min/L) (μmol • min/L) (μmol • min/L) (μmol • min/L)
1146 ± 266 584 ± 167 279 ± 138 224 ± 35 60 ± 21 868 ± 233 129 ± 48 150 ± 36
920 ± 220 483 ± 166 192 ± 85 183 ± 45 63 ± 21 665 ± 179 109 ± 40 146 ± 24
945 ± 248 491 ± 184 202 ± 105 186 ± 14 65 ± 21 622 ± 172 112 ± 47 211 ± 57
1362 ± 204 691 ± 145 166 ± 15 317 ± 93 189 ± 104 886 ± 134 185 ± 46 291 ± 83
1434 ± 292 744 ± 188 152 ± 16 339 ± 127 199 ± 99 958 ± 194 201 ± 61 276 ± 77
1304 ± 246 661 ± 193 137 ± 15 315 ± 92 191 ± 94 877 ± 175 189 ± 65 239 ± 49
0,357 0,427 0,084 0,262 0,574 0,249 0,912 0,882
0,304 0,269 0,474 0,272 0,521 0,285 0,262 0,317 0,226 0,676 0.460 0,159 0,316 0,560 0,214 0,120
Breakfast
Dinner
Breakfast
Dinner
meal time
group group x meal time
Control Lunch
Type 2 diabetes Lunch
P values
Table 3. Peak times of postprandial bile acid responses. P values represent the effects of the fixed effects of meal time and group x meal time interaction as assessed with a Repeated Measures General Linear Model.
Total bile acids (min) CDCA (min) CA (min) DCA (min) UDCA (min) Glycine conjugates (min) Taurine conjugates (min) Unconjugated (min)
160 ± 20 160 ± 20 130 ± 18 120 ± 16 170 ± 24 180 ± 22 150 ± 26 140 ± 37
190 ± 18 150 ± 26 130 ± 24 190 ± 19 160 ± 25 160 ± 25 110 ± 29 100 ± 55
150 ± 26 150 ± 26 190 ± 18 130 ± 29
90 ± 20 90 ± 30 90 ± 20
100 ± 13 100 ± 13 170 ± 36 144 ± 41 120 ± 19 100 ± 13 100 ± 13 170 ± 45
70 ± 10 70 ± 10 70 ± 24 72 ± 12 80 ± 13 70 ± 10 70 ± 10 70 ± 29
0,186 0,644 0,286 0,056 0,057 0,189 0,337 0,988
0,001 0,747 0,015 0,709 0,069 0,014 0,060 0,687 0,057 0,916 0.001 0,667 0,070 0,673 0,521 0,062
Breakfast
Dinner
meal time
group group x meal time
Control
Lunch Dinner Breakfast
Type 2 diabetes Lunch
P values
90 ± 20 120 ± 22 110 ± 24 190 ± 18
100 ± 20 120 ± 38 90 ± 30 100 ± 25 130 ± 29
