
Page 132 - Human Bile Acid Metabolism: a Postprandial Perspective
P. 132
Chapter 7
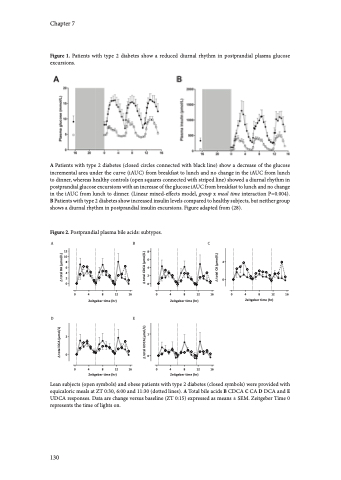
Figure 1. Patients with type 2 diabetes show a reduced diurnal rhythm in postprandial plasma glucose excursions.
A Patients with type 2 diabetes (closed circles connected with black line) show a decrease of the glucose incremental area under the curve (iAUC) from breakfast to lunch and no change in the iAUC from lunch to dinner, whereas healthy controls (open squares connected with striped line) showed a diurnal rhythm in postprandial glucose excursions with an increase of the glucose iAUC from breakfast to lunch and no change in the iAUC from lunch to dinner. (Linear mixed-effects model, group x meal time interaction P=0.004). B Patients with type 2 diabetes show increased insulin levels compared to healthy subjects, but neither group shows a diurnal rhythm in postprandial insulin excursions. Figure adapted from (28).
Figure 2. Postprandial plasma bile acids: subtypes. ABC
12 8 10
862 64
4
2 00
0 4 8 12 16
Zeitgeber time (hr)
DE
2
0
0 4 8 12 16
Zeitgeber time (hr)
0 4 8 12 16
Zeitgeber time (hr)
0 4 8 12 16
Zeitgeber time (hr)
D total DCA (μmol/L)
D total BA (μmol/L)
D total UDCA (μmol/L) D total CDCA (μmol/L)
D total CA (μmol/L)
0 4 8 12 16
Zeitgeber time (hr)
2
1
0
0
Lean subjects (open symbols) and obese patients with type 2 diabetes (closed symbols) were provided with equicaloric meals at ZT 0:30, 6:00 and 11:30 (dotted lines). A Total bile acids B CDCA C CA D DCA and E UDCA responses. Data are change versus baseline (ZT 0:15) expressed as means ± SEM. Zeitgeber Time 0 represents the time of lights on.
130
