
Page 131 - Human Bile Acid Metabolism: a Postprandial Perspective
P. 131
DCA: 1.1 μmol/L, UDCA: 1.5 μmol/L, taurine conjugates: 0.5 μmol/L, glycine conjugates: 3.0 μmol/L, unconjugated: 1.4 μmol/L. Power analysis was performed with a significance level of 0.05 a power of 80% and the observed standard deviations, using nQuery Advisor 7.0 (Statistical Solutions Limited).
Data are presented as means with their standard errors of the mean. The postprandial period was defined to extend until 180min after meal onset, and AUCs were calculated with the trapezoid rule with Excel 2010 (Microsoft, Redmond, Washington, USA). Individual postprandial peak times were defined as the first timepoint at which maximal concentration was reached. AUC and peak time data were subsequently analyzed with a full factorial repeated measures general linear model with meal time as the within-subjects factor and group as the between-subjects factor. Fasting BA levels were assessed with a two-tailed independent-samples Student’s t-test. All statistical tests were performed with IBM SPSS Statistics (version 21; SPSS, Inc.).
Results
We included 6 obese patients with type 2 diabetes (age 60±3 yr, BMI 30±1 kg/m2, 7 all metformin users, diabetes duration 9±4 yr) and 6 healthy lean control subjects
(age 57±4 yr, BMI 24±1 kg/m2) (28).
As described previously (28) the diurnal rhythm of plasma glucose iAUC was different between obese patients with type 2 diabetes and healthy controls. The obese patients with type 2 diabetes showed a decrease in plasma glucose iAUC
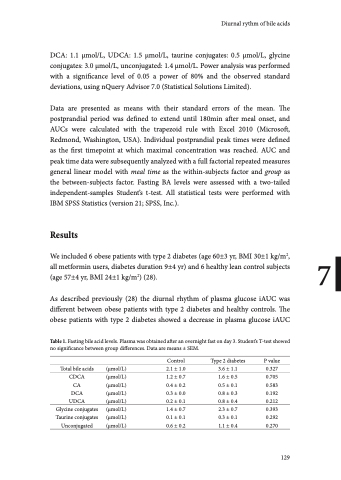
Table 1. Fasting bile acid levels. Plasma was obtained after an overnight fast on day 3. Student’s T-test showed no significance between group differences. Data are means ± SEM.
Diurnal rythm of bile acids
Total bile acids CDCA
CA
DCA UDCA Glycine conjugates Taurine conjugates Unconjugated
(μmol/L) (μmol/L) (μmol/L) (μmol/L) (μmol/L) (μmol/L) (μmol/L) (μmol/L)
Control 2.1 ± 1.0 1.2 ± 0.7 0.4 ± 0.2 0.3 ± 0.0 0.2 ± 0.1 1.4 ± 0.7 0.1 ± 0.1 0.6 ± 0.2
Type 2 diabetes 3.6 ± 1.1 1.6 ± 0.5 0.5 ± 0.1 0.8 ± 0.3 0.8 ± 0.4 2.3 ± 0.7 0.3 ± 0.1 1.1 ± 0.4
P value 0.327 0.705 0.583 0.192 0.212 0.393 0.292 0.270
129
