
Page 116 - Demo
P. 116
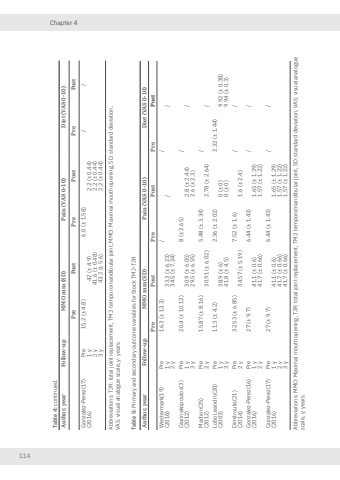
Chapter 4114Table 4: continued.Author, year Follow-up MMO mm (SD) Pain (VAS 0-10) Diet (VAS 0-10)Pre Post Pre Post Pre PostGonzalez-Perez(17) (2016)Pre1 y2 y3 y15.2 (± 4.8)42 (± 4.9)41.6 (± 0.48)43.2 (± 5.6)6.0 (± 1.58)2.2 (± 0.44)2.2 (± 0.44)2.2 (± 0.44)/ /Abbreviations: TJR: total joint replacement, TMJ: temporomandibular joint, MMO: Maximal mouth opening, SD: standard deviation, VAS: visual analogue scale, y: years.Table 5: Primary and secondary outcome variables for Stock TMJ-TJRAuthor, year Follow-up MMO mm (SD) Pain (VAS 0-10) Diet (VAS 0-10)Pre Post Pre Post Pre PostWestermark(19)(2010)Pre1 y2 y16.3 (± 13.3)33.3 (± 6.23)34.5 (± 7.24)////Giannakopoulos(3)(2012)Pre1 y3 y20.4 (± 10.12)30.9 (± 6.05)29.5 (± 6.55)8 (± 2.65)2.8 (± 2.44)2.6 (± 2.3)//Machon(25)(2012)Pre2 y15.87 (± 8.16)30.91 (± 6.02)5.48 (± 3.34)2.78 (± 2.64)//Lobo Leandro(20)(2003)Pre1 y3 y11.3 (± 4.2)38.9 (± 6)41.8 (± 4.5)2.36 (± 2.02)0 (± 0)0 (± 0)2.32 (± 1.44)9.92 (± 0.38)9.94 (± 0.3)Dimitroulis(21)(2014)Pre2 y32.53 (± 6.85)34.57 (± 5.19)7.52 (± 1.6)1.6 (± 2.4)/ /Gonzalez-Perez(16)(2016)Pre1 y2 y27 (± 9.7)41.1 (± 0.6)41.7 (± 0.66)6.44 (± 1.43)1.65 (± 1.29)1.57 (± 1.22)/ /Gonzalez-Perez(17)(2016)Pre1 y2 y3 y27 (± 9.7)41.1 (± 0.6)41.7 (± 0.66)41.7 (± 0.66)6.44 (± 1.43)1.65 (± 1.29)1.57 (± 1.22)1.57 (± 1.22)/ /Abbreviations: MMO: Maximal mouth opening, TJR: total joint replacement, TMJ: temporomandibular joint, SD: standard deviation, VAS: visual analogue scale, y: years.Nikolas de Meurechy NW.indd 114 05-06-2024 10:14
