
Page 101 - Physiological based CPAP for preterm infants at birth Tessa Martherus
P. 101
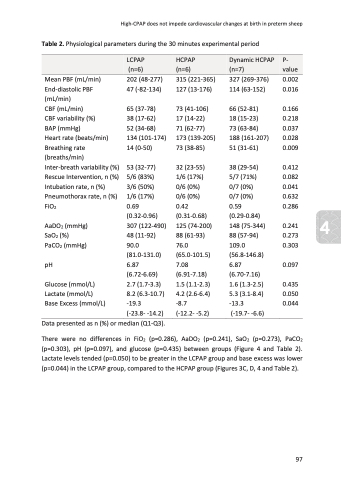
High-CPAP does not impede cardiovascular changes at birth in preterm sheep Table 2. Physiological parameters during the 30 minutes experimental period
LCPAP
HCPAP
P- (n=6)     (n=6) (n=7) value
Dynamic HCPAP
        Mean PBF (mL/min) End-diastolic PBF (mL/min)
CBF (mL/min)
CBF variability (%)
BAP (mmHg)
Heart rate (beats/min) Breathing rate (breaths/min) Inter-breath variability (%) Rescue Intervention, n (%) Intubation rate, n (%) Pneumothorax rate, n (%) FiO2
AaDO2 (mmHg) SaO2 (%) PaCO2 (mmHg)
pH
Glucose (mmol/L) Lactate (mmol/L) Base Excess (mmol/L)
202 (48-277) 47 (-82-134)
65 (37-78)
38 (17-62)
52 (34-68) 134 (101-174) 14 (0-50)
53 (32-77) 5/6 (83%)
3/6 (50%)
1/6 (17%) 0.69 (0.32-0.96) 307 (122-490) 48 (11-92) 90.0 (81.0-131.0) 6.87 (6.72-6.69) 2.7 (1.7-3.3) 8.2 (6.3-10.7) -19.3
315 (221-365) 127 (13-176)
73 (41-106) 17 (14-22)
71 (62-77) 173 (139-205) 73 (38-85)
32 (23-55) 1/6 (17%) 0/6 (0%)
0/6 (0%) 0.42 (0.31-0.68) 125 (74-200) 88 (61-93) 76.0 (65.0-101.5) 7.08 (6.91-7.18) 1.5 (1.1-2.3) 4.2 (2.6-6.4) -8.7
(-12.2- -5.2)
327 (269-376) 114 (63-152)
66 (52-81)
18 (15-23)
73 (63-84) 188 (161-207) 51 (31-61)
38 (29-54) 5/7 (71%) 0/7 (0%)
0/7 (0%) 0.59 (0.29-0.84) 148 (75-344) 88 (57-94) 109.0 (56.8-146.8) 6.87 (6.70-7.16) 1.6 (1.3-2.5) 5.3 (3.1-8.4) -13.3
(-19.7- -6.6)
0.002 0.016
0.166 0.218 0.037 0.028 0.009
0.412 0.082 0.041 0.632 0.286
4
P
        (-23.8- -14.2) Data presented as n (%) or median (Q1-Q3).
0.241 0.273 0.303
0.097
0.435 0.050 0.044
 There were no differences in FiO2 (p=0.286), AaDO2 (p=0.241), SaO2 (p=0.273), PaCO2 (p=0.303), pH (p=0.097), and glucose (p=0.435) between groups (Figure 4 and Table 2). Lactate levels tended (p=0.050) to be greater in the LCPAP group and base excess was lower (p=0.044) in the LCPAP group, compared to the HCPAP group (Figures 3C, D, 4 and Table 2).
97
r
