
Page 129 - Migraine, the heart and the brain
P. 129
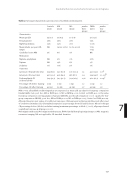
                                Table 5. Participant characteristics and outcomes of eyeblink conditioning test.
Cerebellar function and ischemic brain lesions in migraine
 Controls (n=31)
54 (7.0) 58% 93% NA
3%
NA NA 0%
554 (85.6) 421 (90.6) 72.3 (30.3)
5 (13) 46 (36)
MA (n=38)
57 (8.4)
58%
92%
14 (26; 1–170)
8%
3% 13% 10%
520 (89.8) 405 (84.9) 72.9 (30.7)
6 (15) 50 (33)
MO (n=35)
56 (6.8)
77%
91%
16 (19; 3–105)
6%
0% 8% 7%
501 (100.3) 387 (87.1) 74.2 (26.9)
6 (14) 42 (33)
p value three groups
FHM1 (n=11)
40 (12.9)
73%
100%
7 (15; 1–52)
NA
27% 9% 9%
420 (92.5) 224 (94.7) 46.2 (16.9)
9 (14) 42 (34)
p value four groups
 Characteristics
Mean age (SD)
Female gender
Right-handedness
Mean attacks per year (SD; range)
Cerebellar lesion MRI Medication:
Migraine prophylaxis Triptans
Sedatives
Outcomes
Latency to CR peak time (ms)
Latency to CR onset (ms)
Peak amplitude CR (% from full UR)
Percentage CR before training Percentage CR after training
0.3 0.4 0.98
0.9 0.7
a 0.01 b
< 0.001 0.045c
0.9 0.8
 MRI n =103; all eyeblink conditioning values are expressed as mean ±SD. ap value for four-group comparison
Kruskal-Wallis test; post hoc; MA vs FHM1 p=0.01, MO vs FHM1 p = 0.03, Control vs. FHM1 p= 0.001. bp value
four-group comparison one-way analysis of variance (ANOVA), post hoc all comparison <0.001. cp value for four-
group comparison ANOVA); post hoc; MA vs FHM1 p= 0.02, MO vs FHM1 p= 0.005, Control vs. FHM1 p=0.014.
All peak-time and onset values of conditioned responses (CRs) expressed as latency in milliseconds after onset
of conditioned stimulus (CS); CR amplitude expressed as percentage from full eyelid closure. When looking at 7 CR percentage before (block 1) and after training (maximum percentage in block 6, 7 or 8), all groups showed
a signi cant increase (p all groups <0.001).
MA: migraine with aura; MO: migraine without aura; FHM1: familial hemiplegic migrainetype 1; MRI: magnetic resonance imaging; NA: not applicable; SD: standard deviation.
127
