
Page 145 - Functional impairment and cues for rehabilitation of head and neck cancer patients -
P. 145
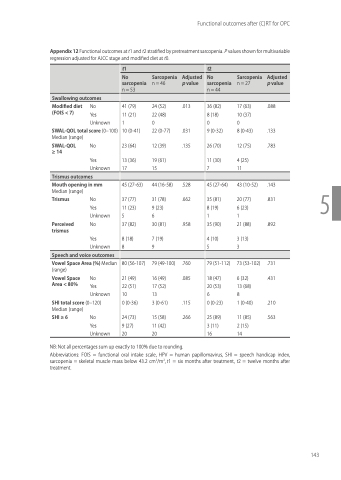
Appendix 12 Functional outcomes at t1 and t2 stratified by pretreatment sarcopenia. P values shown for multivariable regression adjusted for AJCC stage and modified diet at t0.
         t1
    Sarcopenia
n = 46
t2
    No sarcopenia n = 53
Adjusted p value
No sarcopenia n = 44
Sarcopenia
n = 27
Adjusted p value
         Swallowing outcomes
         41 (79) 24 (52) .013 11 (21) 22 (48) 10
10 (0-41) 23 (64)
22 (0-77) .031 12 (39) .135 19 (61)
13 (36)
17 15
         Trismus outcomes
         Median (range)
Trismus
Perceived trismus
No
Yes Unknown No
Yes Unknown
5
Vowel Space Area (%) Median (range)
Vowel Space No
Yes Unknown
Area < 80%
SHI total score (0–120)
Median (range)
SHI ≥ 6 No
Yes Unknown
NB: Not all percentages sum up exactly to 100% due to rounding.
Yes Unknown
45 (27-63)
44 (16-58) .528
31 (78) .662 9 (23)
37 (77)
11 (23)
56
37 (82) 30 (81) .958
8 (18) 7 (19) 89
         Speech and voice outcomes
         80 (56-107)
21 (49) 22 (51) 10
0 (0-36)
24 (73) 9 (27) 20
79 (49-100) .760
16 (49) .085 17 (52)
13
3 (0-61) .115
15 (58) .266 11 (42)
20
 Abbreviations: FOIS = functional oral intake scale, HPV = human papillomavirus, SHI = speech handicap index, sarcopenia = skeletal muscle mass below 43.2 cm2/m2, t1 = six months after treatment, t2 = twelve months after treatment.
Functional outcomes after (C)RT for OPC
  Modified diet No
36 (82) 8 (18)
0
9 (0-32)
26 (70)
11 (30) 7
45 (27-64)
35 (81) 8 (19) 1
35 (90)
4 (10) 5
79 (51-112)
18 (47) 20 (53) 6
0 (0-23)
25 (89) 3 (11) 16
17 (63) 10 (37) 0
8 (0-43)
12 (75)
4 (25) 11
43 (10-52)
20 (77) 6 (23) 1
21 (88)
3 (13) 3
73 (53-102)
6 (32) 13 (68) 8
1 (0-40)
11 (85) 2 (15) 14
.088
.133 .783
.143 .831
.892
.731 .431
.210 .563
(FOIS < 7)
SWAL-QOL total score (0–100)
Median (range) SWAL-QOL No
≥ 14
Yes Unknown
Mouth opening in mm
  143
