
Page 139 - Functional impairment and cues for rehabilitation of head and neck cancer patients -
P. 139
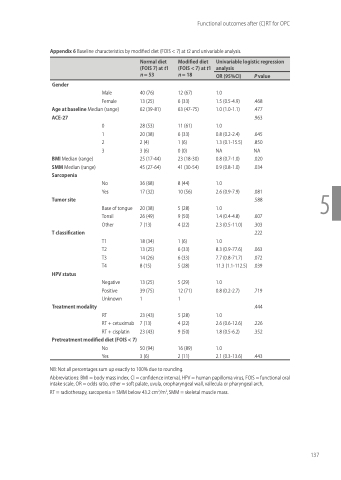
Appendix 6 Baseline characteristics by modified diet (FOIS < 7) at t2 and univariable analysis.
Female Age at baseline Median (range)
6 (33)
63 (47-75)
1.5 (0.5-4.9) .468 1.0 (1.0-1.1) .477 .963
ACE-27
BMI Median (range) SMM Median (range) Sarcopenia
Tumor site
T classification
HPV status
6 (33)
1 (6)
0 (0)
23 (18-30) 41 (30-54)
0.8 (0.2-2.4) .645 1.3 (0.1-15.5) .850 NA NA 0.8 (0.7-1.0) .020 0.9 (0.8-1.0) .034
Treatment modality
0.8 (0.2-2.7) .719
.444
2.6 (0.6-12.6) .226
2 (11)
Pretreatment modified diet (FOIS < 7)
No Yes
1.8 (0.5-6.2) .352 2.1 (0.3-13.6) .443
0 1 2 3
No Yes
Base of tongue Tonsil
Other
T1 T2 T3 T4
Negative Positive Unknown
RT
RT + cetuximab RT + cisplatin
11 (61) 1.0
Functional outcomes after (C)RT for OPC
   Normal diet (FOIS 7) at t1 n = 53
  Modified diet (FOIS < 7) at t1 n = 18
  Univariable logistic regression analysis
   OR (95%CI)
  P value
  Gender
Male
40 (76)
13 (25)
62 (39-81)
28 (53)
20 (38)
2 (4)
3 (6)
25 (17-44) 45 (27-64)
36 (68) 17 (32)
20 (38) 26 (49) 7 (13)
18 (34) 13 (25) 14 (26) 8 (15)
13 (25) 39 (75) 1
23 (43) 7 (13) 23 (43)
50 (94) 3 (6)
12 (67) 1.0
8 (44) 1.0
10 (56)
5 (28) 1.0
5
9 (50) 4 (22)
1.4 (0.4-4.8) .607 2.3 (0.5-11.0) .303 .222
1 (6) 1.0
6 (33) 6 (33) 5 (28)
8.3 (0.9-77.6) .063 7.7 (0.8-71.7) .072 11.3 (1.1-112.5) .039
5 (29) 1.0
12 (71) 1
5 (28) 1.0 4 (22)
9 (50)
16 (89) 1.0
2.6 (0.9-7.9) .081 .588
 NB: Not all percentages sum up exactly to 100% due to rounding.
Abbreviations: BMI = body mass index, CI = confidence interval, HPV = human papilloma virus, FOIS = functional oral intake scale, OR = odds ratio, other = soft palate, uvula, oropharyngeal wall, vallecula or pharyngeal arch,
RT = radiotherapy, sarcopenia = SMM below 43.2 cm2/m2, SMM = skeletal muscle mass.
137
