
Page 138 - Functional impairment and cues for rehabilitation of head and neck cancer patients -
P. 138
Chapter 5
136
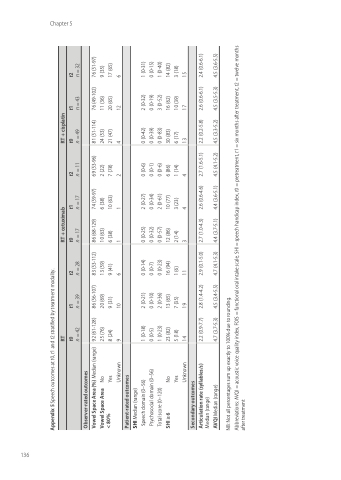
Appendix 5 Speech outcomes at t0, t1 and t2 stratified by treatment modality.
Observer-rated outcomes
Vowel Space Area (%) Median (range)
n = 42
92 (61-128)
n = 39
86 (56-107)
n = 28
83 (53-112)
n = 17
86 (68-129)
n = 17
74 (59-97)
n = 11
69 (53-96)
n = 49
81 (51-114)
n = 43
76 (49-102)
n = 32
76 (51-97)
Vowel Space Area No
25 (76) 8 (24) 9
20 (69) 9 (31) 10
13 (59) 9 (41) 6
10 (63) 6 (38) 1
6 (38) 10 (63) 1
2 (22) 7 (78) 2
24 (53) 21 (47) 4
11 (36) 20 (65) 12
9 (35) 17 (65) 6
< 80%
Yes
Patient-rated outcomes
SHI Median (range)
Speech domain (0–56) Psychosocial domain (0–56) Total score (0–120)
1 (0-18) 0 (0-5) 1 (0-23) 23 (82) 5 (18) 14
2 (0-21) 0 (0-10) 2 (0-36) 13 (65) 7 (35) 19
0 (0-14) 0 (0-7) 0 (0-23) 16 (94) 1 (6)
0 (0-25) 0 (0-32) 0 (0-57) 12 (86) 2 (14)
2 (0-27) 0 (0-34) 2 (0-61) 10 (77) 3 (23)
0 (0-6) 0 (0-1) 0 (0-6) 6 (86) 1 (14) 4
0 (0-42) 0 (0-39) 0 (0-83) 30 (83) 6 (17) 13
2 (0-32) 0 (0-19) 3 (0-52) 16 (62) 10 (39) 17
1 (0-31) 0 (0-15) 1 (0-40) 14 (82) 3 (18) 15
SHI ≥ 6 No Yes
Secondary outcomes Articulation rate (syllables/s)
2.2 (0.9-7.7)
2.8 (1.4-4.2)
2.9 (0.1-5.0) 4.7 (4.1-5.3)
2.7 (1.0-4.3) 4.4 (3.7-5.1)
2.6 (0.6-4.6) 4.4 (3.6-5.1)
2.7 (1.6-5.1) 4.5 (4.1-5.2)
2.2 (0.2-5.8) 4.5 (3.3-5.2)
2.6 (0.6-6.1) 4.5 (3.5-5.3)
2.4 (0.6-6.1) 4.5 (3.6-5.5)
Median (range) AVQI Median (range)
Unknown
Unknown
11
3
4
4.7 (3.7-5.3)
NB: Not all percentages sum up exactly to 100% due to rounding.
RT RT + cetuximab RT + cisplatin
t0 t1 t2 t0 t1 t2 t0 t1 t2
4.5 (3.4-5.5)
Abbreviations: AVQI = acoustic voice quality index, FOIS = functional oral intake scale, SHI = speech handicap index, t0 = pretreatment, t1 = six months after treatment, t2 = twelve months after treatment
