
Page 125 - Physico-Chemical Niche Conditions for Bone Cells
P. 125
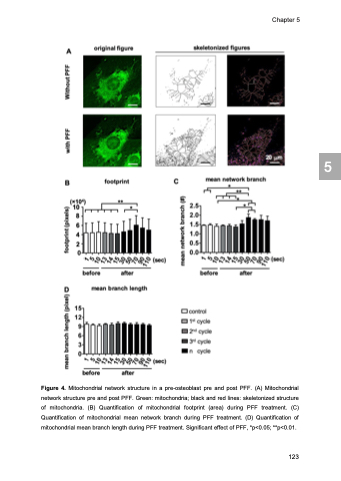
Figure 4. Mitochondrial network structure in a pre-osteoblast pre and post PFF. (A) Mitochondrial network structure pre and post PFF. Green: mitochondria; black and red lines: skeletonized structure of mitochondria. (B) Quantification of mitochondrial footprint (area) during PFF treatment. (C) Quantification of mitochondrial mean network branch during PFF treatment. (D) Quantification of mitochondrial mean branch length during PFF treatment. Significant effect of PFF, *p<0.05; **p<0.01.
Chapter 5
 123
 5
