
Page 123 - Physico-Chemical Niche Conditions for Bone Cells
P. 123
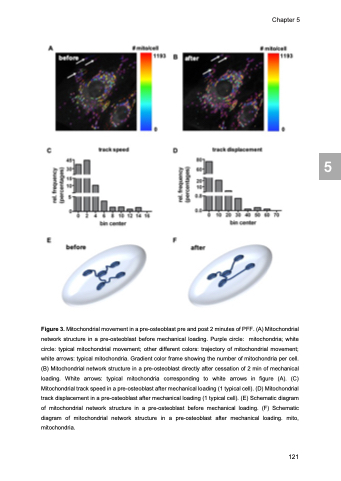
Figure 3. Mitochondrial movement in a pre-osteoblast pre and post 2 minutes of PFF. (A) Mitochondrial network structure in a pre-osteoblast before mechanical loading. Purple circle: mitochondria; white circle: typical mitochondrial movement; other different colors: trajectory of mitochondrial movement; white arrows: typical mitochondria. Gradient color frame showing the number of mitochondria per cell. (B) Mitochondrial network structure in a pre-osteoblast directly after cessation of 2 min of mechanical loading. White arrows: typical mitochondria corresponding to white arrows in figure (A). (C) Mitochondrial track speed in a pre-osteoblast after mechanical loading (1 typical cell). (D) Mitochondrial track displacement in a pre-osteoblast after mechanical loading (1 typical cell). (E) Schematic diagram of mitochondrial network structure in a pre-osteoblast before mechanical loading. (F) Schematic diagram of mitochondrial network structure in a pre-osteoblast after mechanical loading. mito, mitochondria.
Chapter 5
 121
 5
