
Page 127 - Physico-Chemical Niche Conditions for Bone Cells
P. 127
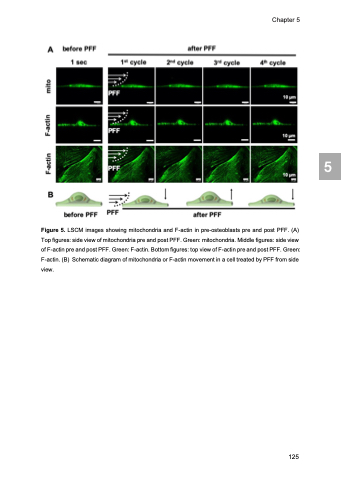
Figure 5. LSCM images showing mitochondria and F-actin in pre-osteoblasts pre and post PFF. (A) Top figures: side view of mitochondria pre and post PFF. Green: mitochondria. Middle figures: side view of F-actin pre and post PFF. Green: F-actin. Bottom figures: top view of F-actin pre and post PFF. Green: F-actin. (B) Schematic diagram of mitochondria or F-actin movement in a cell treated by PFF from side view.
Chapter 5
 125
 5
