
Page 134 - 89Zr-Immuno-PET:Towards a Clinical Tool to Guide Antibody-based Therapy in Cancer
P. 134
Chapter 6
There was no difference in interobserver variability for VOI delineated at D3 or D6 for 89Zr-rituximab (6 vs 8%, p =0.38, n=26). To obtain tumor uptake at D0 (without visible tumor contrast), a different technique was applied (importing VOI delineated at D6 to the D0 scan). Using this method, interobserver variability for SUVmean at D0 was 13% (8-28) for 89Zr-rituximab and 10% (5-27) for 89Zr- cetuximab (Supplemental Table 1). Interobserver variability did not change after viewing the corresponding 18F-FDG-PET (p=0.62, n = 25 VOI adapted by at least 1 observer).
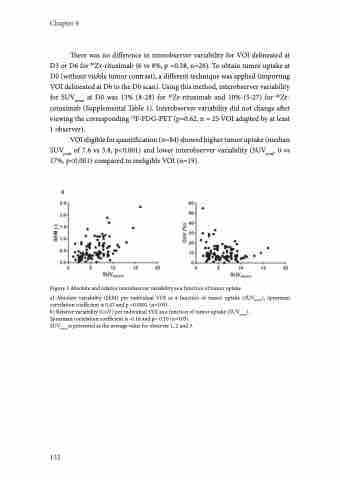
VOI eligible for quantification (n=84) showed higher tumor uptake (median SUVpeak of 7.6 vs 3.8, p<0.001) and lower interobserver variability (SUVpeak, 0 vs 17%, p<0.001) compared to ineligible VOI (n=19).
Figure 3 Absolute and relative interobserver variability as a function of tumor uptake
a) Absolute variability (SEM) per individual VOI as a function of tumor uptake (SUVmean), Spearman correlation coefficient is 0.47 and p <0.0001 (n=103).
b) Relative variability (CoV) per individual VOI as a function of tumor uptake (SUVmean).
Spearman correlation coefficient is -0.16 and p= 0.10 (n=103).
SUVmean is presented as the average value for observer 1, 2 and 3.
132
