
Page 84 - Effects of radiotherapy and hyperbaric oxygen therapy on oral microcirculation Renee Helmers
P. 84
Chapter 4
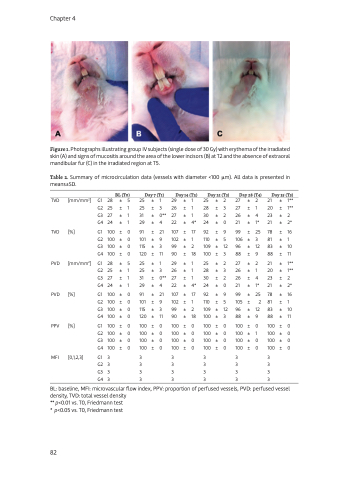
Figure 1. Photographs illustrating group IV subjects (single dose of 30 Gy) with erythema of the irradiated skin (A) and signs of mucositis around the area of the lower incisors (B) at T2 and the absence of extraoral mandibular fur (C) in the irradiated region at T5.
Table 2. Summary of microcirculation data (vessels with diameter <100 mm). All data is presented in means±SD.
TVD [mm/mm2]
TVD [%]
PVD [mm/mm2]
PVD [%]
PPV [%]
MFI [0,1,2,3]
BL (T0)
G1 28 ± 5 G2 25 ± 1 G3 27 ± 1 G4 24 ± 1
G1 100 ± 0 G2 100 ± 0 G3 100 ± 0 G4 100 ± 0
G1 28 ± 5 G2 25 ± 1 G3 27 ± 1 G4 24 ± 1
G1 100 ± 0 G2 100 ± 0 G3 100 ± 0 G4 100 ± 0
G1 100 ± 0 G2 100 ± 0 G3 100 ± 0 G4 100 ± 0
G1 3 G23 G33 G43
Day 7 (T1)
25 ± 1 25 ±3 31 ± 0** 29 ± 4
91 ± 21 101 ±9 115 ± 3 120 ± 11
25 ± 1 25 ±3 31 ± 0** 29 ± 4
91 ± 21 101 ±9 115 ± 3 120 ± 11
100 ±0 100 ±0 100 ±0 100 ±0
3 3 3 3
Day 14 (T2)
29 ± 1 26 ±1 27 ± 1 22 ± 4*
107 ±17 102 ±1 99 ± 2 90 ±18
29 ± 1 26 ±1 27 ± 1 22 ± 4*
107 ±17 102 ±1 99 ± 2 90 ±18
100 ±0 100 ±0 100 ±0 100 ±0
3 3 3 3
Day 21 (T3)
25 ± 2 28 ±3 30 ± 2 24 ± 0
92 ±9 110 ±5 109 ± 12 100 ±3
25 ± 2 28 ±3 30 ± 2 24 ± 0
92 ±9 110 ±5 109 ± 12 100 ±3
100 ±0 100 ±0 100 ±0 100 ±0
3 3 3 3
Day 28 (T4)
27 ± 2
Day 35 (T5)
21 ± 1** 20 ± 1** 23 ± 2 21 ± 2*
78 ±16 81 ±1 83 ± 10 88 ±11
21 ± 1** 20 ± 1** 23 ± 2 21 ± 2*
78 ±16 81 ±1 83 ± 10 88 ±11
100 ±0 100 ±0 100 ±0 100 ±0
3 3 3 3
27 ± 26 ± 21 ±
99 ± 106 ± 96 ± 88 ±
27 ± 26 ± 26 ± 21 ±
99 ± 105 ± 96 ± 88 ±
100 ± 100 ± 100 ± 100 ±
3 3 3 3
1 4 1*
25 3 12 9
2 1 4 1*
25 2
12 9
0 1 0 0
BL: baseline, MFI: microvascular flow index, PPV: proportion of perfused vessels, PVD: perfused vessel density, TVD: total vessel density
** p<0.01 vs. T0, Friedmann test
* p<0.05 vs. T0, Friedmann test
82
