
Page 36 - Effects of radiotherapy and hyperbaric oxygen therapy on oral microcirculation Renee Helmers
P. 36
Chapter 2
Normobaric hyperoxia
A summary of NB hyperoxia basic hemodynamic and blood gas parameters is presented in the first part of Tables 2 and 3 respectively. A statistically significant increase in systolic blood pressure was observed at FiO2 55% (T1) and 100% (T2) when compared to baseline (T0) (p=0.009 and p=0.040 respectively). MAP was stable throughout the experimental procedures except during the first hyperoxic maneuver, when the highest statistically significant rise in MAP was observed during FiO2 55% (T1) (p=0.023 vs. T0). No other statistically significant differences were observed for the remaining hemodynamic parameters. There were no statistically significant changes in arterial pH levels. Assessments of paO2 and sO2 revealed significant elevations in both parameters during FiO2 55% (T1) and 100% (T2) (p=0.018 respectively), these parameters normalized again after returning to normoxia (T3).
Microcirculation data coinciding with NB hyperoxic time points is presented in the first part of Table 4. Comparative analysis of baseline (T0) TVD and PVD revealed a significant mean 16% decrease in sublingual microvascular density for both FiO2 55% (T1) and 100% (T2) (p=0.005 and p=0.003 respectively). A sample of an SDFI-derived sequence of vessel density changes during the NB experiments is illustrated in Figure 3A. A statistically significant increase in vasoconstriction (10%) compared to baseline (T0) was observed for Øbv during FiO2 55% (T1) and 100% (T2) (p=0.009 and p=0.047 respectively). Further visual inspection of microhemodynamics in the SDFI footage during hyperoxia FiO2 55% (T1) and 100% (T2) revealed the presence of scattered circulating microthrombi in small arterioles and venules and crawling leukocytes in larger venules in the microcirculation. No significant differences were observed for PPV or MFI.
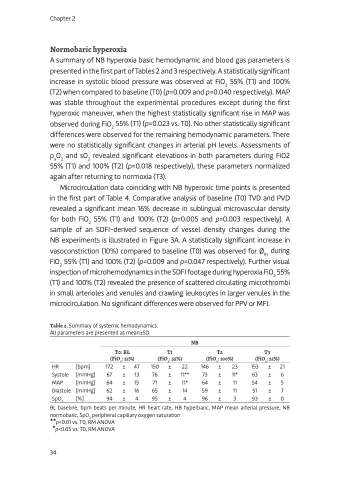
Table 2. Summary of systemic hemodynamics. All parameters are presented as mean±SD.
T0: BL T1 (FiO2: 21%) (FiO2: 55%)
NB
T2 T3 (FiO2: 100%) (FiO2: 21%)
HR [bpm] 172 ± 47 150 ± 22 146 ± 23 153 ± 21 Systole [mmHg] 67 ± 13 76 ± 11** 73 ± 11* 63 ± 6 MAP [mmHg] 64 ± 15 71 ± 11* 64 ± 11 54 ± 5 Diastole [mmHg] 62 ± 16 65 ± 14 59 ± 11 51 ± 7 SpO2 [%] 94 ± 4 95 ± 4 96 ± 3 93 ± 0
BL baseline, bpm beats per minute, HR heart rate, HB hyperbaric, MAP mean arterial pressure, NB normobaric, SpO2 peripheral capillary oxygen saturation
**p<0.01 vs. T0, RM ANOVA
*p<0.05 vs. T0, RM ANOVA 34
