
Page 47 - Demo
P. 47
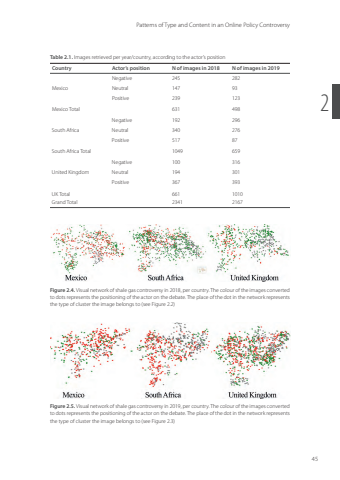
Patterns of Type and Content in an Online Policy Controversy452Table 2.1. Images retrieved per year/country, according to the actor’s positionCountry Actor’s position N of images in 2018 N of images in 2019MexicoNegative 245 282Neutral 147 93Positive 239 123Mexico Total 631 498South AfricaNegative 192 296Neutral 340 276Positive 517 87South Africa Total 1049 659United KingdomNegative 100 316Neutral 194 301Positive 367 393UK Total 661 1010Grand Total 2341 2167Figure 2.4. Visual network of shale gas controversy in 2018, per country. The colour of the images converted to dots represents the positioning of the actor on the debate. The place of the dot in the network represents the type of cluster the image belongs to (see Figure 2.2)Figure 2.5. Visual network of shale gas controversy in 2019, per country. The colour of the images converted to dots represents the positioning of the actor on the debate. The place of the dot in the network represents the type of cluster the image belongs to (see Figure 2.3)Efrat.indd 45 19-09-2023 09:47
