
Page 42 - Demo
P. 42
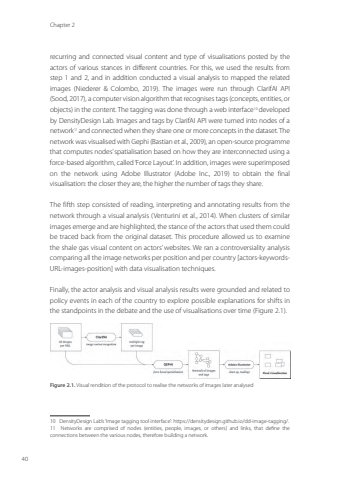
Chapter 240recurring and connected visual content and type of visualisations posted by the actors of various stances in different countries. For this, we used the results from step 1 and 2, and in addition conducted a visual analysis to mapped the related images (Niederer & Colombo, 2019). The images were run through ClarifAI API (Sood, 2017), a computer vision algorithm that recognises tags (concepts, entities, or objects) in the content. The tagging was done through a web interface10developed by DensityDesign Lab. Images and tags by ClarifAI API were turned into nodes of a network11 and connected when they share one or more concepts in the dataset. The network was visualised with Gephi (Bastian et al., 2009), an open-source programme that computes nodes’ spatialisation based on how they are interconnected using a force-based algorithm, called ‘Force Layout’. In addition, images were superimposed on the network using Adobe Illustrator (Adobe Inc., 2019) to obtain the final visualisation: the closer they are, the higher the number of tags they share.The fifth step consisted of reading, interpreting and annotating results from the network through a visual analysis (Venturini et al., 2014). When clusters of similar images emerge and are highlighted, the stance of the actors that used them could be traced back from the original dataset. This procedure allowed us to examine the shale gas visual content on actors’ websites. We ran a controversiality analysis comparing all the image networks per position and per country [actors-keywordsURL-images-position] with data visualisation techniques.Finally, the actor analysis and visual analysis results were grounded and related to policy events in each of the country to explore possible explanations for shifts in the standpoints in the debate and the use of visualisations over time (Figure 2.1).Figure 2.1. Visual rendition of the protocol to realise the networks of images later analysed10 DensityDesign Lab’s ‘Image tagging tool interface’: https://densitydesign.github.io/dd-image-tagging/.11 Networks are comprised of nodes (entities, people, images, or others) and links, that define the connections between the various nodes, therefore building a network.Efrat.indd 40 19-09-2023 09:47
