
Page 159 - Demo
P. 159
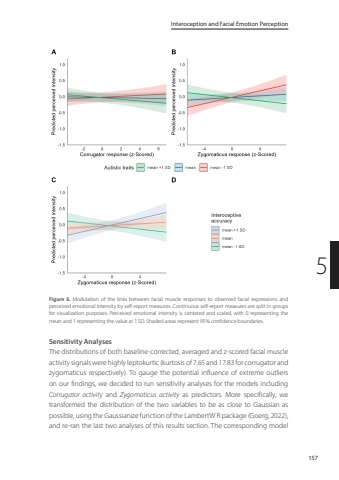
Interoception and Facial Emotion Perception1575Figure 6. Modulation of the links between facial muscle responses to observed facial expressions and perceived emotional intensity by self-report measures. Continuous self-report measures are split in groups for visualization purposes. Perceived emotional intensity is centered and scaled, with 0 representing the mean and 1 representing the value at 1 SD. Shaded areas represent 95% confidence boundaries. Sensitivity AnalysesThe distributions of both baseline-corrected, averaged and z-scored facial muscle activity signals were highly leptokurtic (kurtosis of 7.65 and 17.83 for corrugator and zygomaticus respectively). To gauge the potential influence of extreme outliers on our findings, we decided to run sensitivity analyses for the models including Corrugator activity and Zygomaticus activity as predictors. More specifically, we transformed the distribution of the two variables to be as close to Gaussian as possible, using the Gaussianize function of the LambertW R package (Goerg, 2022), and re-ran the last two analyses of this results section. The corresponding model
