
Page 50 - Peri-implant health: the effect of implant design and surgical procedure on bone and soft tissue stability
P. 50
CHAPTER 3
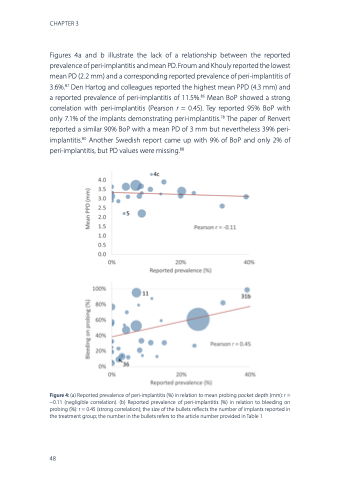
Figures 4a and b illustrate the lack of a relationship between the reported prevalence of peri‐implantitis and mean PD. Froum and Khouly reported the lowest mean PD (2.2 mm) and a corresponding reported prevalence of peri‐implantitis of 3.6%.87 Den Hartog and colleagues reported the highest mean PPD (4.3 mm) and a reported prevalence of peri‐implantitis of 11.5%.86 Mean BoP showed a strong correlation with peri‐implantitis (Pearson r = 0.45). Tey reported 95% BoP with only 7.1% of the implants demonstrating peri‐implantitis.78 The paper of Renvert reported a similar 90% BoP with a mean PD of 3 mm but nevertheless 39% peri- implantitis.80 Another Swedish report came up with 9% of BoP and only 2% of peri‐implantitis, but PD values were missing.88
Figure 4: (a) Reported prevalence of peri‐implantitis (%) in relation to mean probing pocket depth (mm): r = −0.11 (negligible correlation). (b) Reported prevalence of peri‐implantitis (%) in relation to bleeding on probing (%): r = 0.45 (strong correlation); the size of the bullets reflects the number of implants reported in the treatment group; the number in the bullets refers to the article number provided in Table 1
48
