
Page 48 - Peri-implant health: the effect of implant design and surgical procedure on bone and soft tissue stability
P. 48
CHAPTER 3
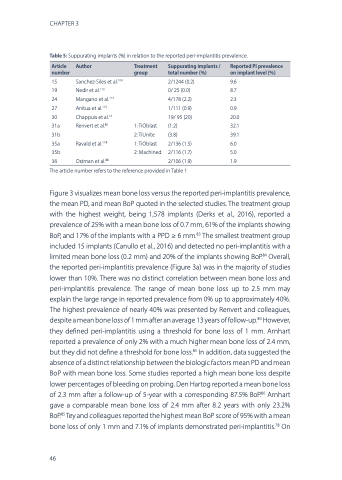
Table 5: Suppurating implants (%) in relation to the reported peri‐implantitis prevalence.
Article number
Author
Treatment group
Suppurating implants / total number (%)
Reported PI prevalence on implant level (%)
15 Sanchez-Siles et al.104 19 Nedir et al.110
24 Mangano et al.113
27 Anitua et al.115
30 Chappuis et al.14 31a Renvert et al.80 31b
35a Ravald et al.118 35b
36 Ostman et al.88
1: TiOblast 2: TiUnite
1: TiOblast 2: Machined
2/1244 (0.2) 9.6 0/ 25 (0.0) 8.7 4/178 (2.2) 2.3 1/111 (0.9) 0.9 19/ 95 (20) 20.0 (1.2) 32.1 (3.8) 39.1 2/136 (1.5) 6.0 2/116 (1.7) 5.0 2/106 (1.9) 1.9
The article number refers to the reference provided in Table 1
Figure 3 visualizes mean bone loss versus the reported peri‐implantitis prevalence, the mean PD, and mean BoP quoted in the selected studies. The treatment group with the highest weight, being 1,578 implants (Derks et al., 2016), reported a prevalence of 25% with a mean bone loss of 0.7 mm, 61% of the implants showing BoP, and 17% of the implants with a PPD ≥ 6 mm.83 The smallest treatment group included 15 implants (Canullo et al., 2016) and detected no peri‐implantitis with a limited mean bone loss (0.2 mm) and 20% of the implants showing BoP.84 Overall, the reported peri‐implantitis prevalence (Figure 3a) was in the majority of studies lower than 10%. There was no distinct correlation between mean bone loss and peri‐implantitis prevalence. The range of mean bone loss up to 2.5 mm may explain the large range in reported prevalence from 0% up to approximately 40%. The highest prevalence of nearly 40% was presented by Renvert and colleagues, despite a mean bone loss of 1 mm after an average 13 years of follow‐up.80 However, they defined peri‐implantitis using a threshold for bone loss of 1 mm. Arnhart reported a prevalence of only 2% with a much higher mean bone loss of 2.4 mm, but they did not define a threshold for bone loss.85 In addition, data suggested the absence of a distinct relationship between the biologic factors mean PD and mean BoP with mean bone loss. Some studies reported a high mean bone loss despite lower percentages of bleeding on probing. Den Hartog reported a mean bone loss of 2.3 mm after a follow‐up of 5‐year with a corresponding 87.5% BoP.86 Arnhart gave a comparable mean bone loss of 2.4 mm after 8.2 years with only 23.2% BoP.85 Tey and colleagues reported the highest mean BoP score of 95% with a mean bone loss of only 1 mm and 7.1% of implants demonstrated peri‐implantitis.78 On
46
