
Page 51 - Peri-implant health: the effect of implant design and surgical procedure on bone and soft tissue stability
P. 51
HOW DO PERI-IMPLANT BIOLOGIC PARAMETERS CORRESPOND WITH IMPLANT SURVIVAL AND PERI-IMPLANTITIS? A CRITICAL REVIEW
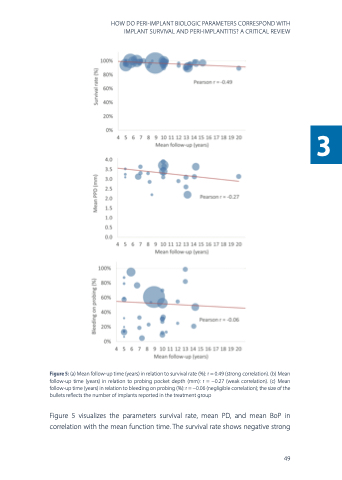
Figure 5: (a) Mean follow‐up time (years) in relation to survival rate (%): r = 0.49 (strong correlation). (b) Mean follow‐up time (years) in relation to probing pocket depth (mm): r = −0.27 (weak correlation). (c) Mean follow‐up time (years) in relation to bleeding on probing (%): r = −0.06 (negligible correlation); the size of the bullets reflects the number of implants reported in the treatment group
Figure 5 visualizes the parameters survival rate, mean PD, and mean BoP in correlation with the mean function time. The survival rate shows negative strong
49
3
