
Page 73 - Quantitative Imaging of Small Tumours with Positron Emission Tomography
P. 73
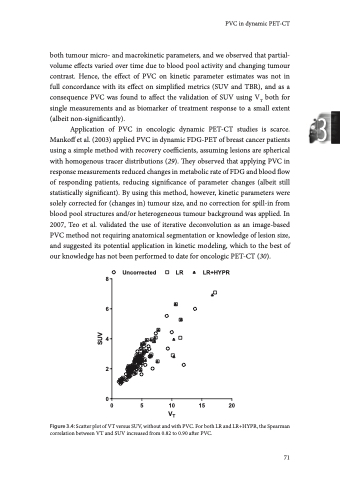
Chapter 3 A VT BP B Uncorrected LR LR+HYPR Uncorrected LR LR+HYPR Correlation CD Correlation Uncorrected LR LR+HYPR Uncorrected LR LR+HYPR Correlation Correlation Figure 3.5: Correlation (Spearman) between changes in kinetic parameter estimates vs. simplified metrics during treatment with TKI, with and without PVC. Results shown are for SUV at 7 (A) and 28 (B) days, and for TBR at 7 (C) and 28 (D) days after treatment start. Both tumour macroparameters VT and BPND, and microparameter K1 significantly changed after application of PVC. This corresponds with results from applications of PVC in brain dynamic PET studies, where similar increases in kinetic parameter estimations have been observed when applying PVC in case of activity spill-out (19-21,31). Interestingly, the effect of PVC on kinetic parameter estimates was poorly (albeit significantly) correlated with its effect on simplified measures. As previously described(9), the effect of PVC on SUV of (hotspot) lesions on static PET-CT scans is straightforward: an expected net increase in activity, mainly dependent on lesion size (and, in lesser extent, shape and local contrast). This can be seen in Figure 3.2, where change in SUV after PVC is highly (inversely) correlated to tumour volume, whilst the kinetic parameter estimations are not. This illustrates that impact of PVC on tumour kinetic 72 0.0 0.2 0.0 0.2 0.4 0.6 0.4 0.6 0.8 1.0 0.8 1.0 0.0 0.2 0.0 0.2 0.4 0.6 0.4 0.6 0.8 1.0 0.8 1.0
