
Page 71 - Quantitative Imaging of Small Tumours with Positron Emission Tomography
P. 71
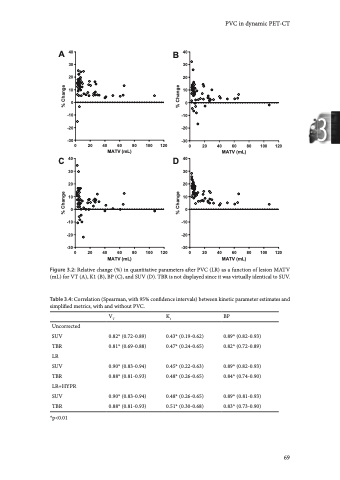
Chapter 3 during treatment with TKIs for the uncorrected data as well as those with PVC (Figure 3.5). At both 7 and 28 days after treatment start, changes in VT and BPND were significantly correlated (0.79-0.98 and 0.44-0.91, respectively) with changes in SUV and TBR (with the exception of correlation between changes in BPND vs. TBR on LR images at 7 days; 0.45, p>0.05), regardless of PVC. PVC (both LR and LR+HYPR) did not improve correlations between treatment induced changes in BP and changes in SUV or TBR. PVC increased the correlation between treatment- induced changes in SUV and VT at 7 days and 28 days (increases in correlation ranging 0.05-0.09, with overlapping confidence intervals). Also, PVC increased the correlation between treatment-induced changes in TBR with changes in VT at 28 days, but not at 7 days, after treatment start by 0.06 for both LR and LR+HYPR, with overlapping confidence intervals. 10 0 -10 -20 -30 -400 20 40 60 80 100 120 MATV (mL) Figure 3.3: Relative difference (%) in lesion MATV (mL) between uncorrected and PVC images (LR+HYPR) as function of MATV on uncorrected images. Y-axis was scaled to -40%; for one lesion of 5.8ml MATV was 69% smaller on PVC image. Discussion In the present study we evaluated the impact of frame-wise parametric PVC on tumour kinetic parameter estimation derived from dynamic PET-CT scans and the resulting effect on validation of simplified metrics. PVC significantly increased 70 % difference in MATV
