
Page 69 - Quantitative Imaging of Small Tumours with Positron Emission Tomography
P. 69
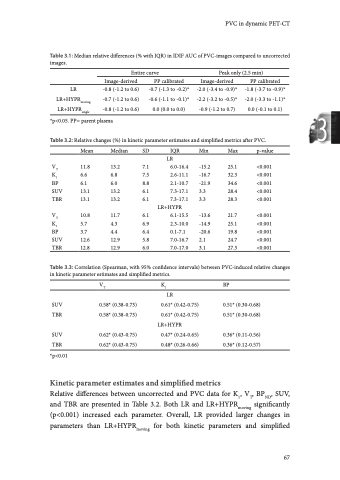
Chapter 3 metrics. Regarding kinetic parameters, largest changes were seen for VT, which was increased by median 13.2% up to 25.1% using LR. Changes in K1 and BPND were very similar (median 6.8% and 6.0%, respectively, using LR). Changes in SUV and TBR after PVC were almost identical, as expected, and were comparable to changes in VT. LR and LR+HYPRmoving decreased VT, K1 and BPND in some lesions, but only provided increases for SUV and TBR. Changes in VT, K1 and BPND after PVC had low but significant correlations with changes in SUV and TBR after PVC (Table 3.3); highest correlations were seen between relative changes in VT and changes in SUV and TBR (up to 0.62). We plotted relative changes in VT, K1, BPND, and SUV after PVC as a function of lesion (original) MATV to provide insight into effect of lesion size on PVC performance (Figure 3.2). For LR, the correlations between MATV and relative change in VT, K1, BPND, SUV, and TBR were -0.39, -0.47, -0.36, -0.80, and -0.80, respectively (p<0.01). For LR+HYPR, these correlations were -0.43, -0.34, -0.24, -0.81, -0.80, respectively (p<0.01, except for BPND; p=0.07). Compared to tumour delineation on uncorrected images, delineation on partial-volume corrected images (LR+HYPRmoving) provided a median relative decrease in MATV of 14.3%, (IQR -22.1 to -7.5, minimum -69.2, maximum 5.3; Figure 3.3). Also, the effect of PVC on kinetic parameters and simplified metrics was higher when using VOIs generated on PVC images compared to when using original VOIs (Supplemental Table 3). Here, largest increases after PVC were seen for VT, SUV, and TBR with median increases of 13.9% (IQR 7.6-18.7; max 37.8%), 15.8% (IQR 8.4-20.4; max 31.5), and 15.8% (IQR 8.4-20.7; max 34%), respectively. Technical validation of simplified metrics PVC increased the correlations between SUV and VT and K1, but not for BPND (Table 3.4). PVC increased the correlations between TBR and VT, K1, and BPND (Table 3.4). Largest increases in these correlations were seen between VT and SUV (0.82 to 0.90; Figure 3.4). However, confidence intervals of these correlations overlapped and therefore were not statistically significant. During treatment, VT, BPND, SUV, and TBR significantly decreased, while K1 did not change (as was also observed in Frings et al. (5)), regardless of PVC (p-values in Supplemental Table 4). At 7 and 28 days after starting treatment, original MATV demonstrated a median decrease of 16.1% (IQR -38.9 to -0.6), and 17.6% (IQR -58.3 to 4.3). We correlated treatment-induced relative changes in kinetic parameters to treatment-induced relative changes in simplified metrics 68
