
Page 140 - Coronary hemodynamics in acute myocardial infarction - Matthijs Bax
P. 140
Chapter 8
Association between admission glucose and microvascular function after PPCI
No association was found between admission glucose levels with CFVRIRA, as well as bAPVIRA or hAPVIRA measured directly after revascularisation.
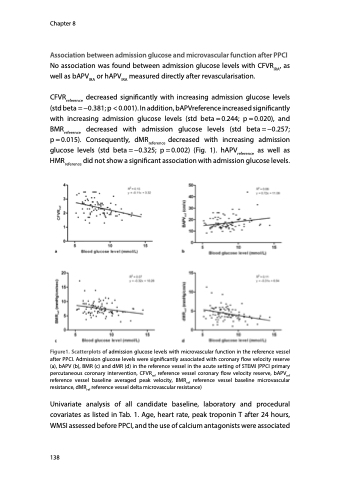
CFVRreference decreased significantly with increasing admission glucose levels (std beta = −0.381; p < 0.001). In addition, bAPVreference increased significantly with increasing admission glucose levels (std beta=0.244; p=0.020), and BMRreference decreased with admission glucose levels (std beta=−0.257; p=0.015). Consequently, dMRreference decreased with increasing admission glucose levels (std beta=−0.325; p=0.002) (Fig. 1). hAPVreference as well as HMRreference did not show a significant association with admission glucose levels.
Figure1. Scatterplots of admission glucose levels with microvascular function in the reference vessel after PPCI. Admission glucose levels were significantly associated with coronary flow velocity reserve (a), bAPV (b), BMR (c) and dMR (d) in the reference vessel in the acute setting of STEMI (PPCI primary percutaneous coronary intervention, CFVRref reference vessel coronary flow velocity reserve, bAPVref reference vessel baseline averaged peak velocity, BMRref reference vessel baseline microvascular resistance, dMRref reference vessel delta microvascular resistance)
Univariate analysis of all candidate baseline, laboratory and procedural covariates as listed in Tab. 1. Age, heart rate, peak troponin T after 24 hours, WMSI assessed before PPCI, and the use of calcium antagonists were associated
138
