
Page 138 - Coronary hemodynamics in acute myocardial infarction - Matthijs Bax
P. 138
Chapter 8
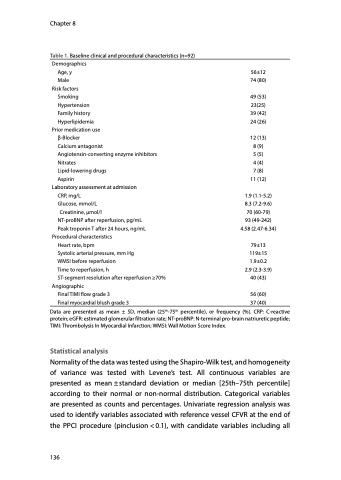
Table 1. Baseline clinical and procedural characteristics (n=92) Demographics
Age, y
Male Risk factors
Smoking Hypertension Family history Hyperlipidemia
Prior medication use β-Blocker
Calcium antagonist Angiotensin-converting enzyme inhibitors Nitrates
Lipid-lowering drugs
Aspirin
Laboratory assessment at admission
CRP, mg/L Glucose, mmol/L
Creatinine, μmol/l
NT-proBNP after reperfusion, pg/mL Peak troponin T after 24 hours, ng/mL
Procedural characteristics
Heart rate, bpm
Systolic arterial pressure, mm Hg
WMSI before reperfusion
Time to reperfusion, h
ST-segment resolution after reperfusion ≥70%
Angiographic
Final TIMI flow grade 3
Final myocardial blush grade 3
56±12 74 (80)
49 (53) 23(25) 39 (42) 24 (26)
12 (13) 8 (9) 5 (5) 4 (4) 7 (8) 11 (12)
1.9 (1.1-5.2) 8.3 (7.2-9.6) 70 (60-79) 93 (49-242) 4.58 (2.47-6.34)
79±13 119±15 1.9±0.2 2.9 (2.3-3.9) 40 (43)
56 (60)
37 (40)
Data are presented as mean ± SD, median (25th-75th percentile), or frequency (%). CRP: C-reactive protein; eGFR: estimated glomerular filtration rate; NT-proBNP: N-terminal pro-brain natriuretic peptide; TIMI: Thrombolysis In Myocardial Infarction; WMSI: Wall Motion Score Index.
Statistical analysis
Normality of the data was tested using the Shapiro-Wilk test, and homogeneity of variance was tested with Levene’s test. All continuous variables are presented as mean±standard deviation or median [25th–75th percentile] according to their normal or non-normal distribution. Categorical variables are presented as counts and percentages. Univariate regression analysis was used to identify variables associated with reference vessel CFVR at the end of the PPCI procedure (pinclusion < 0.1), with candidate variables including all
136
