


Page 45 - Post-traumatic stress disorder in adults with mild intellectual disability: Screening, assessment, and brief intensive EMDR therapy
P. 45
Reliability and validity of DITS-ID
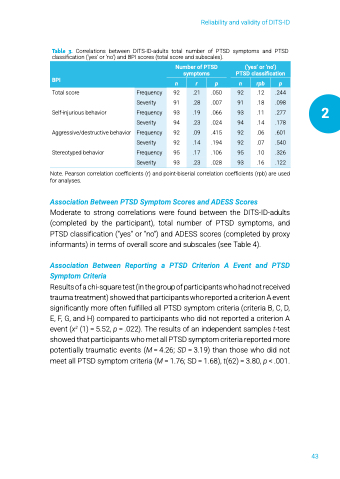
Table 3. Correlations between DITS-ID-adults total number of PTSD symptoms and PTSD
classification (‘yes’ or ‘no’) and BPI scores (total score and subscales).
Number of PTSD
symptoms
(‘yes’ or ‘no’)
PTSD classification
BPI
n r p n rpb p
Total score Frequency 92 .21 .050 92 .12 .244
Severity 91 .28 .007 91 .18 .098
Self-injurious behavior Frequency 93 .19 .066 93 .11 .277
Severity 94 .23 .024 94 .14 .178
Aggressive/destructive behavior Frequency 92 .09 .415 92 .06 .601
Severity 92 .14 .194 92 .07 .540
Stereotyped behavior Frequency 95 .17 .106 95 .10 .326
Severity 93 .23 .028 93 .16 .122
2
Note. Pearson correlation coefficients (r) and point-biserial correlation coefficients (rpb) are used
for analyses.
Association Between PTSD Symptom Scores and ADESS Scores
Moderate to strong correlations were found between the DITS-ID-adults
(completed by the participant), total number of PTSD symptoms, and
PTSD classification (“yes” or “no”) and ADESS scores (completed by proxy
informants) in terms of overall score and subscales (see Table 4).
Association Between Reporting a PTSD Criterion A Event and PTSD
Symptom Criteria
Results of a chi-square test (in the group of participants who had not received
trauma treatment) showed that participants who reported a criterion A event
significantly more often fulfilled all PTSD symptom criteria (criteria B, C, D,
E, F, G, and H) compared to participants who did not reported a criterion A
event (x2 (1) = 5.52, p = .022). The results of an independent samples t-test
showed that participants who met all PTSD symptom criteria reported more
potentially traumatic events (M = 4.26; SD = 3.19) than those who did not
meet all PTSD symptom criteria (M = 1.76; SD = 1.68), t(62) = 3.80, p < .001.
43


