
Page 31 - Epidemiological studies on tuberculosis control and respiratory viruses
P. 31
Distribution of respiratory viruses by illness severity in adults
6
101
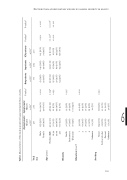
Table 1. Characteristics of the study population by approximated illness severity
Total Sex
HELIUS n (%)* 291
HELIUS n (%)* 297
n (%)* 116
n (%)* 284
n (%)* 200
Age (years)
<0.0015 <0.001
<0.0015 <0.001
Ethnicity
Education (level 6)
Smoking
Male Female
155 (53%) 136 (47%)
120 (40%) 177 (60%)
0.002
63 (54%) 53 (46%)
149 (52%) 135 (48%)
103 (52%) 97 (49%)
0.890
0.008
Median (IQR) 18-34 35-54 ≥55
49 (40-56) 56 (19%) 135 (46%) 100 (34%)
48 (32-55) 81 (27%) 135 (46%) 81 (27%)
0.0144 0.039
53 (38-63) 25 (22%) 37 (32%) 54 (47%)
52 (36-65) 67 (24%) 85 (30%) 132 (47%)
63 (50-74) 21 (11%) 43 (22%) 136 (68%)
Dutch Surinamese Ghanaian
96 (33%) 96 (33%) 99 (34%)
99 (33%)
0.995
Unknown
Never Former smoker Current Unknown
174 (60%) 62 (21%) 54 (19%) 1 (0.3%)
157 (53%) 60 (20%) 60 (20%) 20 (7%)
0.630
1 2 3 4
33 (11%) 89 (31%) 78 (27%) 90 (31%) 1 (0.3%)
40 (14%) 75 (25%) 79 (27%) 83 (28%) 20 (7%)
0.602
Asymptomatic Symptomatic
P-value1
Outpatients
Inpatients
ICU patients
P-value2
P-value3
98 (33%) 100 (34%)
