
Page 21 - Sample Moderate prematurity, socioeconomic status,
and neurodevelopment in early childhood
P. 21
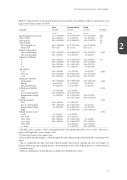
Table 1 Characteristics of moderately preterm-born and term-born children with low, intermediate, and high socioeconomic statusa (n=1470)
a Low SES, scores <= mean -1 SD on standardized SES
mean +1SD; high SES, scores > mean +1 SD.
b P values are based on chi-squared tests.
c SGA, small for gestational age; i.e. birth weight below the 10th percentile of the Dutch Kloosterman growth charts.
d Age at completing the Ages and Stages Questionnaire; uncorrected calendar age. The percentages of children with an age that is appropriate for the 48-month version of the ASQ are given (i.e. between 45 and 51 months of age).
e Extensive information on SES indicators is defined in the Methods section.
Developmental outcomes: risks multiply
Variable
Low
N=260
Intermediate
N=937
High
N=273
P valueb
Moderately preterm-born SGA (<P10)c
Male gender
Age of childd
45-51 months (%)
Mean (SD) Family composition
Two-parent family
One-parent family Number of siblings
0
1
2 ≥3
Age mother < 25
25 to 34
> 34
Ethnicity of mother
Netherlands Europe
Outside of Europe
Education of mothere Low
Low to intermediate Intermediate to high High
Education fathere Low
Low to intermediate Intermediate to high High
Family income (euro)e < 850
851-1150 1151-1750 1751-3050 3051-3500 >= 3501
% (n)
71.9 (187/260) 10.4 (27/260) 58.5 (152/260)
60.4 (148/245) 45.0 (1.3)
87.9 (226/257) 12.1 (31/257)
19.6 (51/260) 50.0 (130/260) 19.6 (51/260) 10.8 (28/260)
13.6 (35/258) 68.2 (176/258) 18.2 (47/258)
90.3 (232/257) 0.4 (1/257) 9.3 (24/257)
7.8 (20/258) 82.9 (214/258) 9.3 (24/258)
-
11.4 (26/228) 78.9 (180/228) 9.6 (22/228)
-
4.3 (8/186) 24.7 (46/186) 43.0 (80/186) 28.0 (52/186)
- -
% (n)
61.5 (576/937) 8.3 (78/937) 53.8 (504/937)
62.7 (572/912) 45.1 (1.4)
94.8 (886/935) 5.2 (49/935)
16.6 (156/937) 55.7 (522/937) 21.5 (201/937) 6.2 (58/937)
7.8 (73/935) 74.0 (692/935) 18.2 (170/935)
95.3 (886/930) 1.8 (17/930) 2.9 (27/930)
0.5 (5/933) 19.0 (177/933) 61.5 (574/933) 19.0 (177/933)
1.2 (11/917) 26.9 (247/917) 50.6 (464/917) 21.3 (195/917)
0.6 (4/722)
3.2 (23/722) 15.9 (109/722) 69.1 (499/722) 8.6 (62/722) 3.5 (25/722)
% (n)
59.7 (163/273) .004 9.2 (25/273) .57 53.1 (145/273) .36 .77
63.2 (170/269) 45.1 (1.3)
98.5 (269/273) < .001 1.5 (4/273)
13.2 (36/273) .07 57.9 (158/273)
22.3 (61/273)
6.6 (18/273)
1.1 (3/273) < .001 72.9 (199/273)
26.0 (71/273)
96.3 (261/271) < .001 2.2 (6/271)
2
1.5 (4/271)
-
-
13.6 (37/272) 86.4 (235/272)
-
0.4 (1/272) 8.1 (22/272)
91.5 (249/272)
-
-
0.9 (2/229)
27.9 (64/229) 24.5 (56/229) 46.7 (107/229)
< .001
< .001
< .001
scale; intermediate SES, scores > mean -1SD and <=
31
