
Page 37 - Towards personalized therapy for metastatic prostate cancer: technical validation of [18F]fluoromethylcholine
P. 37
Dual-phase [18F]FCH PET/CT in prostate cancer
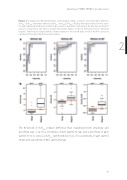
Figure 2. ROC analyses and Threshold boxplots. a. ROC analyses of SUVmax 30min p.i. assessment (late), difference (SUVlate – SUVearly) and relative difference [(SUVlate – SUVearly)/ SUVearly]. The grey lines represent the 500 ROC curves for randomly generated datasets in which only one lesion is included for each patient; the blue lines are the ROC curves for all 54 lesions; the red lines indicate the shortest distance to the top left hand corner; b. Threshold boxplots. Thresholds associated with the shortest distance to the top left hand corner in the ROC curves are indicated in the boxplots by the horizontal red lines.
2
The threshold of SUVmax relative difference that maximized both sensitivity and specificity was -0.19, for a sensitivity of 95% (95%CI 82-99) and a specificity of 94% (95%CI 71-100), versus a SUVmax late threshold of 2.3, for a sensitivity of 92% (95%CI 78-98) and a specificity of 88% (95%CI 64-99).
35
