
Page 36 - Towards personalized therapy for metastatic prostate cancer: technical validation of [18F]fluoromethylcholine
P. 36
Chapter 2
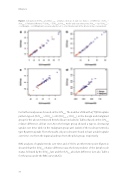
Figure 1. Comparison of SUVmax and SUVmeanA50. a. Early = 2 min p.i.; b. Late = 30 min p.i.; c. Difference = SUVlate – SUVearly; d. Relative difference = (SUVlate – SUVearly)/ SUVearly. At the early scan time point, SUVmax = 1.40*SUVmean – 0.07(Benign) – 0.27(Malignant); versus a reduction of -0.07 in the intercept at the late (30 min p.i.) assessment.
For further analyses we focused on the SUVmax. The number of LN with a [18F]FCH uptake pattern type A (SUVearly > SUVlate) or B (SUVearly ≤ SUVlate), in the benign and malignant group for the above mentioned thresholds are included in Table 3. Based on the SUVmax relative difference, all but one LN in the benign group showed a type A, decreasing uptake over time, while in the malignant group 95% (35/37) of the nodes presented a type B pattern uptake. From the 54 LN, only 3 nodes were found to have a stable uptake over time: one from the inguinal and two from the pelvic group, respectively.
ROC analyses of uptake trends over time and of SUV’s at either time-point (Figure 2) showed that the SUVmax relative difference was the best predictor of the lymph node status, followed by the SUVmax late and the SUVmax absolute difference [see also Table 3 for the areas under the ROC curve (AUC)].
34
