
Page 85 - Demo
P. 85
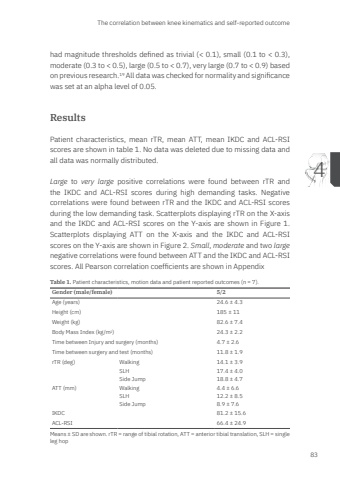
The correlation between knee kinematics and self-reported outcome834had magnitude thresholds defined as trivial (< 0.1), small (0.1 to < 0.3), moderate (0.3 to < 0.5), large (0.5 to < 0.7), very large (0.7 to < 0.9) based on previous research.19 All data was checked for normality and significance was set at an alpha level of 0.05.ResultsPatient characteristics, mean rTR, mean ATT, mean IKDC and ACL-RSI scores are shown in table 1. No data was deleted due to missing data and all data was normally distributed.Large to very large positive correlations were found between rTR and the IKDC and ACL-RSI scores during high demanding tasks. Negative correlations were found between rTR and the IKDC and ACL-RSI scores during the low demanding task. Scatterplots displaying rTR on the X-axis and the IKDC and ACL-RSI scores on the Y-axis are shown in Figure 1. Scatterplots displaying ATT on the X-axis and the IKDC and ACL-RSI scores on the Y-axis are shown in Figure 2. Small, moderate and two largenegative correlations were found between ATT and the IKDC and ACL-RSI scores. All Pearson correlation coefficients are shown in Appendix Table 1. Patient characteristics, motion data and patient reported outcomes (n = 7).Gender (male/female) 5/2Age (years) 24.6 ± 4.3Height (cm) 185 ± 11Weight (kg) 82.6 ± 7.4Body Mass Index (kg/m2) 24.3 ± 2.2Time between Injury and surgery (months) 4.7 ± 2.6Time between surgery and test (months) 11.8 ± 1.9rTR (deg) Walking 14.1 ± 3.9SLH 17.4 ± 4.0Side Jump 18.8 ± 4.7ATT (mm) Walking 4.4 ± 6.6SLH 12.2 ± 8.5Side Jump 8.9 ± 7.6IKDC 81.2 ± 15.6ACL-RSI 66.4 ± 24.9Means ± SD are shown. rTR = range of tibial rotation, ATT = anterior tibial translation, SLH = single leg hop Mark Zee.indd 83 03-01-2024 08:56
