
Page 62 - Demo
P. 62
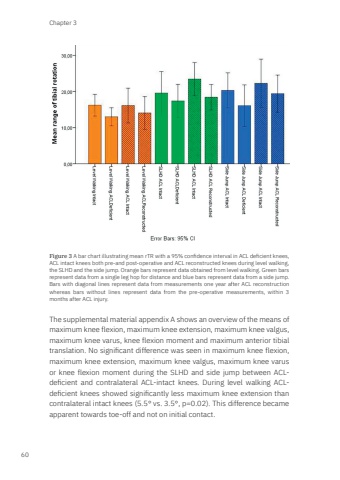
Chapter 360Figure 3 A bar chart illustrating mean rTR with a 95% confidence interval in ACL deficient knees, ACL intact knees both pre-and post-operative and ACL reconstructed knees during level walking, the SLHD and the side jump. Orange bars represent data obtained from level walking. Green bars represent data from a single leg hop for distance and blue bars represent data from a side jump. Bars with diagonal lines represent data from measurements one year after ACL reconstruction whereas bars without lines represent data from the pre-operative measurements, within 3 months after ACL injury.The supplemental material appendix A shows an overview of the means of maximum knee flexion, maximum knee extension, maximum knee valgus, maximum knee varus, knee flexion moment and maximum anterior tibial translation. No significant difference was seen in maximum knee flexion, maximum knee extension, maximum knee valgus, maximum knee varus or knee flexion moment during the SLHD and side jump between ACLdeficient and contralateral ACL-intact knees. During level walking ACLdeficient knees showed significantly less maximum knee extension than contralateral intact knees (5.5° vs. 3.5°, p=0.02). This difference became apparent towards toe-off and not on initial contact.Mark Zee.indd 60 03-01-2024 08:56
