
Page 237 - Microbial methane cycling in a warming world From biosphere to atmosphere Michiel H in t Zandt
P. 237
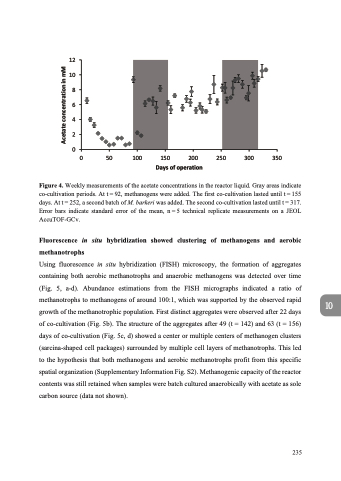
 12 10 8 6 4 2 0
                                                                                                           0 50 100 150 200 250 300 350 Days of operation
Figure 4. Weekly measurements of the acetate concentrations in the reactor liquid. Gray areas indicate co-cultivation periods. At t = 92, methanogens were added. The first co-cultivation lasted until t = 155 days. At t = 252, a second batch of M. barkeri was added. The second co-cultivation lasted until t = 317. Error bars indicate standard error of the mean, n = 5 technical replicate measurements on a JEOL AccuTOF-GCv.
Fluorescence in situ hybridization showed clustering of methanogens and aerobic methanotrophs
Using fluorescence in situ hybridization (FISH) microscopy, the formation of aggregates containing both aerobic methanotrophs and anaerobic methanogens was detected over time (Fig. 5, a-d). Abundance estimations from the FISH micrographs indicated a ratio of methanotrophs to methanogens of around 100:1, which was supported by the observed rapid growth of the methanotrophic population. First distinct aggregates were observed after 22 days of co-cultivation (Fig. 5b). The structure of the aggregates after 49 (t = 142) and 63 (t = 156) days of co-cultivation (Fig. 5c, d) showed a center or multiple centers of methanogen clusters (sarcina-shaped cell packages) surrounded by multiple cell layers of methanotrophs. This led to the hypothesis that both methanogens and aerobic methanotrophs profit from this specific spatial organization (Supplementary Information Fig. S2). Methanogenic capacity of the reactor contents was still retained when samples were batch cultured anaerobically with acetate as sole carbon source (data not shown).
10
 235
Acetate concentration in mM
