
Page 235 - Microbial methane cycling in a warming world From biosphere to atmosphere Michiel H in t Zandt
P. 235
0.5
0.10
0 50 100 150 200 250 300 350
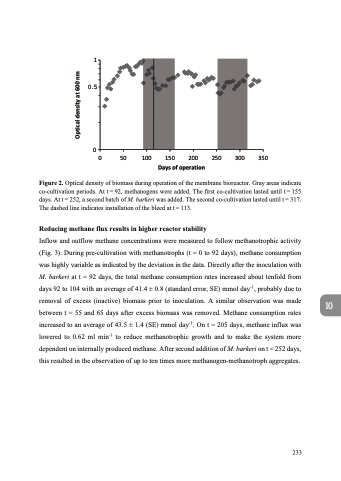
Days of operation
11
Figure 2. Optical density of biomass during operation of the membrane bioreactor. Gray areas indicate co-cultivation periods. At t = 92, methanogens were added. The first co-cultivation lasted until t = 155 days. At t = 252, a second batch of M. barkeri was added. The second co-cultivation lasted until t = 317. The dashed line indicates installation of the bleed at t = 113.
Reducing methane flux results in higher reactor stability
Inflow and outflow methane concentrations were measured to follow methanotrophic activity (Fig. 3). During pre-cultivation with methanotrophs (t = 0 to 92 days), methane consumption was highly variable as indicated by the deviation in the data. Directly after the inoculation with M. barkeri at t = 92 days, the total methane consumption rates increased about tenfold from days 92 to 104 with an average of 41.4 ± 0.8 (standard error, SE) mmol day-1, probably due to removal of excess (inactive) biomass prior to inoculation. A similar observation was made between t = 55 and 65 days after excess biomass was removed. Methane consumption rates increased to an average of 43.5 ± 1.4 (SE) mmol day-1. On t = 205 days, methane influx was lowered to 0.62 ml min-1 to reduce methanotrophic growth and to make the system more dependent on internally produced methane. After second addition of M. barkeri on t = 252 days, this resulted in the observation of up to ten times more methanogen-methanotroph aggregates.
10
233
Optical density at 600 nm
