
Page 48 - Recognizing axial spondyloarthritis - Janneke de Winter
P. 48
CHAPTER THREE
C Name study
Current dactylitis
Gespic
Desir
Esperanza
Pooled prevalence
Pooled prevalence difference
Dactylitis ever
Gespic
SCQM
SPACE
Pooled prevalence
Pooled prevalence difference
Nr‐axSpA Prevalence in
N nr‐axSpA % (95% CI)
226 1.3 (‐0.2‐2.8) 295 12.2 (8.5‐15.9) 182 6.6 (3.0‐10.2) 703 5.2 (0.4‐13.7)
‐0.5 (‐2.6‐1.6)
226 4.0 (1.4‐6.5) 232 11.2 (7.2‐15.3) 93 3.5 (‐1.3‐8.1) 551 6.0 (1.9‐12.0)
‐0.9 (‐6.7‐4.8)
AS Prevalence in AS N % (95% CI)
Weight Prevalence difference % (95% CI) % M‐H, random effects
236 0.9 (0‐2.0) 32.3 180 15.6 (10.3‐20.9) 10.5 109 3.7 (0.1‐7.2) 14.8 525 5.6 (0‐16.2)
236 6.4 (3.2‐9.5) 19.2 838 5.9 (4.3‐7.4) 17.6 25 4.4 (‐4.0‐12.7) 5.6 1099 6.0 (4.7‐7.5) 100.0
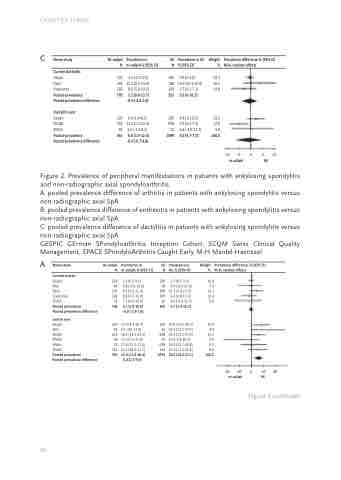
Figure 2. Prevalence of peripheral manifestations in patients with ankylosing spondylitis and non-radiographic axial spondyloarthritis.
A. pooled prevalence difference of arthritis in patients with ankylosing spondylitis versus non-radiographic axial SpA
B: pooled prevalence difference of enthesitis in patients with ankylosing spondylitis versus non-radiographic axial SpA
C: pooled prevalence difference of dactylitis in patients with ankylosing spondylitis versus non-radiographic axial SpA
GESPIC GErman SPondyloarthritis Inception Cohort, SCQM Swiss Clinical Quality Management, SPACE SPondyloArthritis Caught Early, M-H Mantel-Haenszel
A Name study
Current uveitis
Gespic
Kiltz
Desir
Esperanza
SPACE
Pooled prevalence
Pooled prevalence difference
Uveitis ever
Gespic
Kiltz
SCQM
SPACE
Wallis
ESPAC
Pooled prevalence
Pooled prevalence difference
Nr‐axSpA Prevalence in
N nr‐axSpA, % (95% CI)
226 2.2 (0.3‐4.1) 44 6.8 (‐0.6‐14.3) 295 8.1 (5.0‐11.3)
182 8.8 (4.7‐12.9) 52 7.7 (0.5‐14.9) 799 6.1 (2.8‐10.5) ‐0.3 (‐2.3‐1.8)
226 12.4 (8.1‐16.7) 44 9.1 (0.6‐17.6) 232 18.1 (13.2‐23.1)
58 17.2 (7.5‐27.0)
73 27.4 (17.2‐37.6) 132 12.1 (16.6‐17.7) 765 15.9 (11.8‐20.4)
6.2 (2.7‐9.6)
AS Prevalence in N AS, % (95% CI)
Weight Prevalence difference, % (95% CI) % M‐H, random effects
‐10 ‐5 0 5 10
nr‐axSpA AS
236 1.7 (0.1‐3.3) 16.9 56 5.4 (‐0.5‐11.3) 7.5 180 12.2 (7.4‐17.0) 12.1 109 6.4 (1.8‐11.0) 11.4 22 4.6 (‐4.2‐13.3) 6.0
603 5.7 (1.4‐12.2)
236 20.8 (15.6‐26.0) 10.6 56 23.3 (12.2‐34.3) 4.4 838 24.1 (21.2‐27.0) 12.1 23 8.7 (‐2.8‐20.2) 3.9 639 29.3 (25.7‐32.8) 6.3 154 17.4 (11.5‐23.4) 8.8 1974 23.0 (19.2‐27.1) 100.0
46
‐20 ‐10 0 10 20
nr‐axSpA AS
Figure 3 continues
