
Page 47 - Recognizing axial spondyloarthritis - Janneke de Winter
P. 47
P = 0.43, Tau2 = 0.00, I2 = 0%).
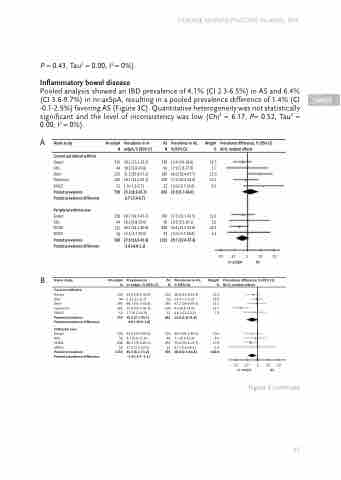
Inflammatory bowel disease
Pooled analysis showed an IBD prevalence of 4.1% (CI 2.3-6.5%) in AS and 6.4% (CI 3.6-9.7%) in nr-axSpA, resulting in a pooled prevalence difference of 1.4% (CI -0.1-2.9%) favoring AS (Figure 3C). Quantitative heterogeneity was not statistically significant and the level of inconsistency was low (Chi2 = 6.17, P= 0.52, Tau2 = 0.00, I2 = 0%).
A Name study
Nr‐axSpA Prevalence in nr‐ N axSpA, % (95% CI)
226 18.1 (13.1‐23.2) 44 18.2 (6.8‐29.6) 295 51.5 (45.8‐57.2) 182 18.7 (13.0‐24.3)
52 1.9 (‐1.8‐5.7)
799 25.2 (8.9‐45.7) 0.7 (‐5.4‐6.7)
226 40.7 (34.3‐47.1) 44 18.2 (6.8‐29.6) 232 40.5 (34.2‐46.8) 58 12.1 (3.7‐20.5) 560 27.9 (16.0‐41.6)
‐3.8 (‐8.8‐1.1)
Nr‐axSpA Prevalence in
N nr‐axSpA, % (95% CI)
226 24.8 (19.2‐30.4) 44 2.3 (‐2.1‐6.7) 295 48.1 (42.4‐53.8)
182 25.8 (19.5‐32.2) 52 7.7 (0.5‐14.9) 747 19.5 (7.1‐35.7)
‐4.9 (‐10.9‐1.0)
236 43.8 (37.4‐50.2) 56 9.1 (0.6‐17.6) 838 80.2 (75.0‐85.3)
58 17.2 (7.5‐27.0)
1155 35.4 (6.1‐71.2) ‐5.4 (‐9.7‐‐1.1)
AS N
236 56 180 109 22 603
236 56 838 23 1153
AS N
236 56 180 109 22 581
226 44 232 23 595
Prevalence in AS, % (95% CI)
Weight Prevalence difference, % (95% CI) % M‐H, random effects
arthritis
difference ever
14.4 (9.9‐18.9) 19.5 17.9 (7.8‐27.9) 5.7 60.6 (53.4‐67.7) 13.0 17.4 (10.3‐24.6) 13.1 13.0 (‐0.7‐26.8) 6.0 22.9 (5.7‐46.0)
37.3 (31.1‐43.5) 13.6 19.6 (9.2‐30.1) 5.6 34.4 (31.2‐37.6) 18.3 13.0 (‐0.7‐26.8) 5.2 29.7 (22.4‐37.4)
DISEASE MANIFESTATIONS IN AXIAL SPA
Current peripheral
Gespic
Kiltz
Desir
Esperanza
SPACE
Pooled prevalence Pooled prevalence
Peripheral arthritis
Gespic
Kiltz
SCQM
SPACE
Pooled prevalence
Pooled prevalence difference
Name study
Current enthesitis
Gespic
Kiltz
Desir
Esperanza
SPACE
Pooled prevalence
Pooled prevalence difference
Enthesitis ever
Gespic
Kiltz
SCQM
SPACE
Pooled prevalence
Pooled prevalence difference
B
Prevalence in AS, % (95% CI)
Weight Prevalence difference % (95% CI) % M‐H, random effects
‐20 ‐10 0 10 20
nr‐axSpA AS
20.8 (15.6‐25.9) 13.2 1.8 (‐1.7‐5.3) 18.9 47.2 (39.9‐54.5) 10.1 9.2 (3.8‐14.6) 11.7 4.6 (‐4.2‐13.3) 7.4 13.6 (1.8‐31.8)
39.4 (33.2‐45.6) 10.6 7.1 (0.4‐13.9) 8.0 73.8 (70.8‐76.7) 17.8 8.7 (‐2.8‐20.2) 2.4 28.8 (2.6‐64.8) 100.0
‐20 ‐10 0 10 20
nr‐axSpA AS
Figure 2 continues
45
THREE
